
WA Nuclear Energy Concept and Plant Locations
-
- Western Australian Electricity – The Low Carbon, Low Cost, Nuclear Energy Option
- SWIS Generating Capacity
- The Challenge and Performance of Renewables
- Impact of Solar PV on grid stability
- Nuclear Energy in Western Australia
- Concept for Small Nuclear Power Plants (SMR’s) on the SWIS
- Locations for small nuclear power plants on the SWIS
- Emissions benefits of Nuclear
- Cooling WA Nuclear Plants
Edition 4, Revised 6/01/2022
Western Australian Electricity – The Low Carbon, Low Cost, Nuclear Energy Option
Western Australia is our largest state with a land area of 2,529,875 square kilometres. It has around 2.6 million people, or 11% of the national population. With its small isolated population and without any grid connection to the remainder of the nation it has unique challenges in establishing low carbon generation.
Firstly, the state generates electricity in three system, none of which are interconnected. Two of these systems produce 53.5% of the State’s electricity. They are the diversified group of remote communities and resource projects plus the North West Interconnected system. These are fueled by methane burners and petroleum products.
The third and largest single market in Western Australia is the South West Interconnected System (SWIS) serving ninety two percent of the population which is concentrated in the south west corner.
This system is the subject of this discussion
The three systems in the state generated a total of 43.6 TWh[ii] of electricity in 2020. Approximately 17.5 TWh of electricity[iii] or about 40% of the state’s total was delivered by network generators on the SWIS while the remaining 6.5% came from roof top solar PV.
Peak and Minimum demands are:
- SWIS, Peak is taken to be 3897MW[v] in summer.
- Day min was 1200MW and is now falling below 1,000MW on a regular basis.
- Night Minimum is approximately 1500MW
The Challenge and Performance of Renewables
The major aim of renewables is to reduce emissions in a robust manner and to do it at a reasonable cost. In 2021 the electricity generated on the SWIS came from methane burning with 34% and coal with 44%.
Historically wind energy started in WA in around 2006 and solar somewhat later in around 2012. After nearly two decades their effectiveness in decarbonisinng the energy supply has not been significant.
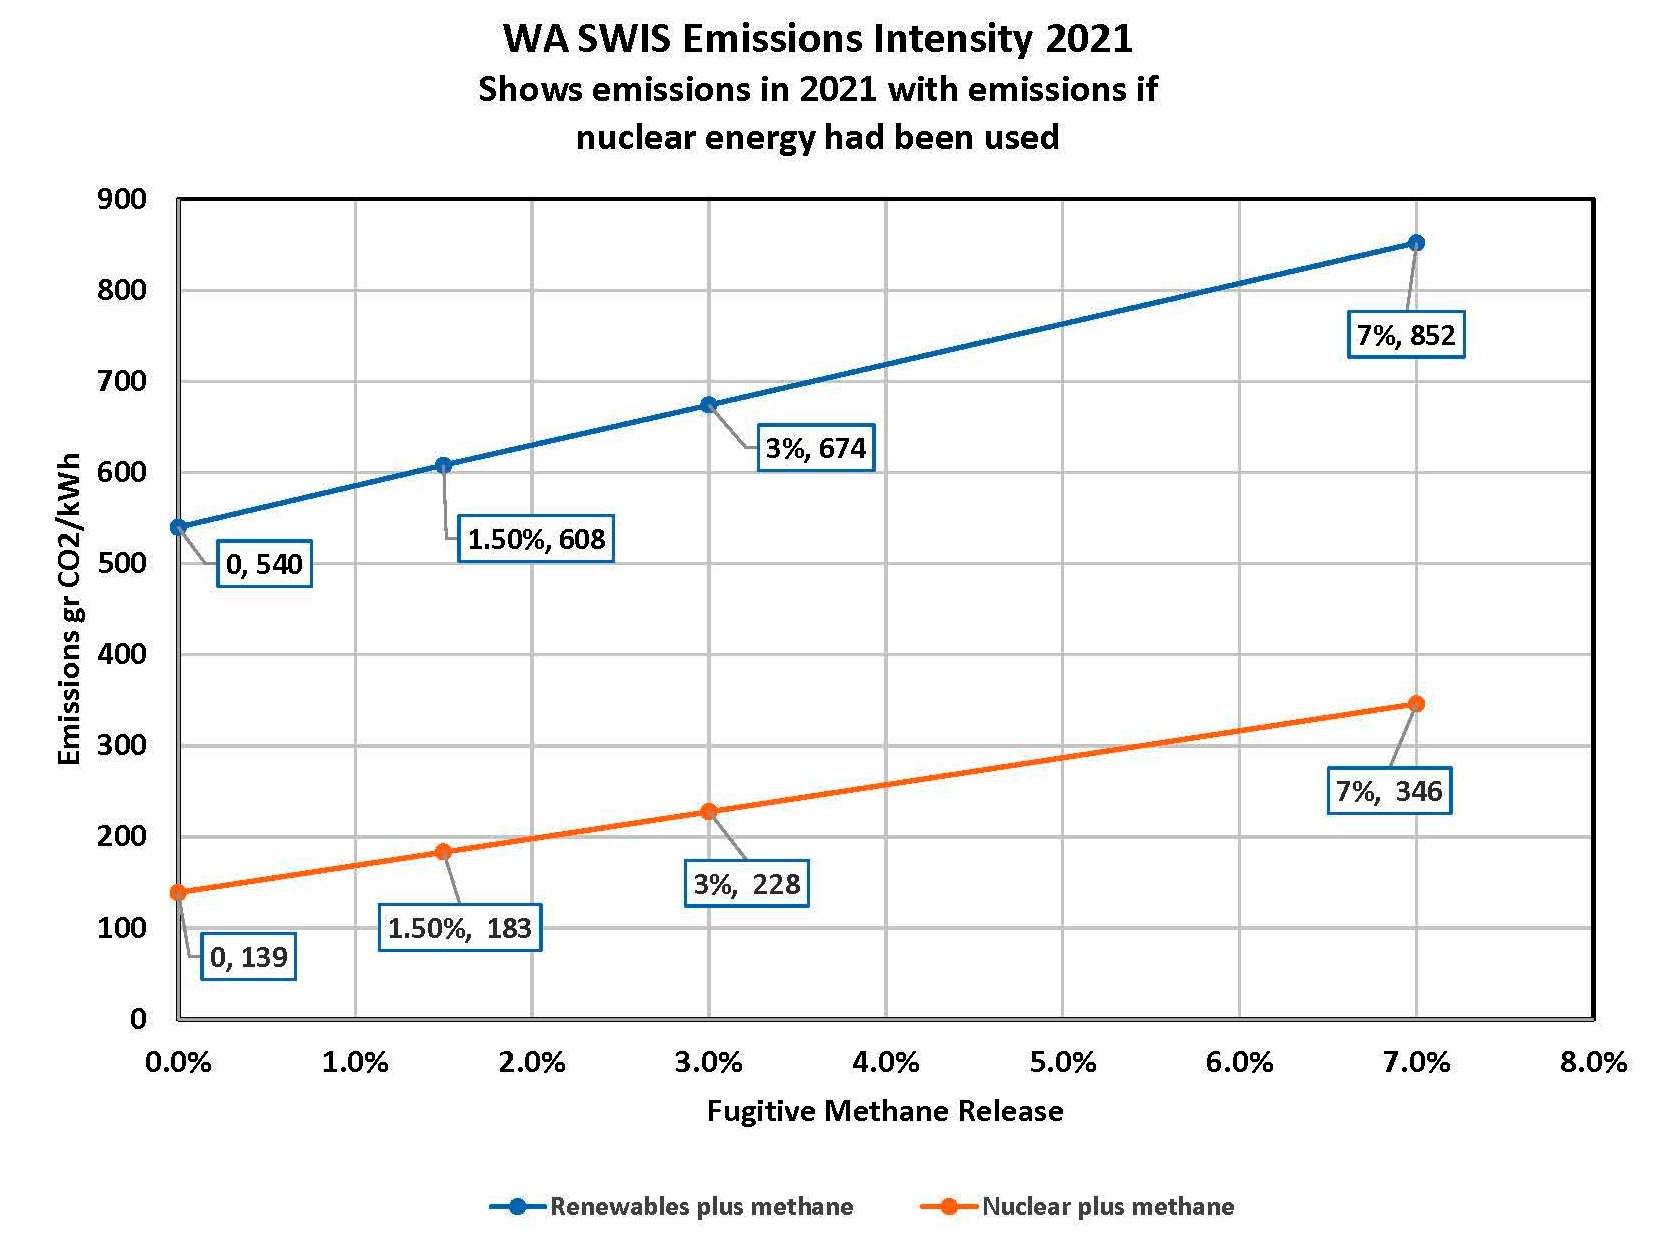
As the following image shows, if we assume zero fugitive methane losses from the state’s methane burners, the electricity emissions intensity is around 540 gr CO2/kWh. Adopting a more realistic value of fugitive methane losses of say 2.5% then the emissions intensity is around 650 gr CO2/kWh which after nearly two decades is an appalling outcome.
France for example decarbonised its electricity system in about 22 years.

WA SWIS Emissions intensity vs Ffugitive emissions release
Impact of Solar PV on grid stability
Modelling for AEMO’s March 2019 Report into integrating renewables found that without new technologies, the SWIS was at risk of failure as the level of minimum operational demand approaches 700 MW. Voltage and system strength limits are at risk below the 700 MW threshold where demand must be met entirely by utility-scale synchronous generation such as gas and coal.
These levels are now getting very close with the following image showing that a level of 912MW was reached on the 1st January this year. We also show that on the 28th December 3,641 MW of power was required in the shoulder period. This underpins the need for at least 4,000MW of reliably dispatchable generation to address peak loads.
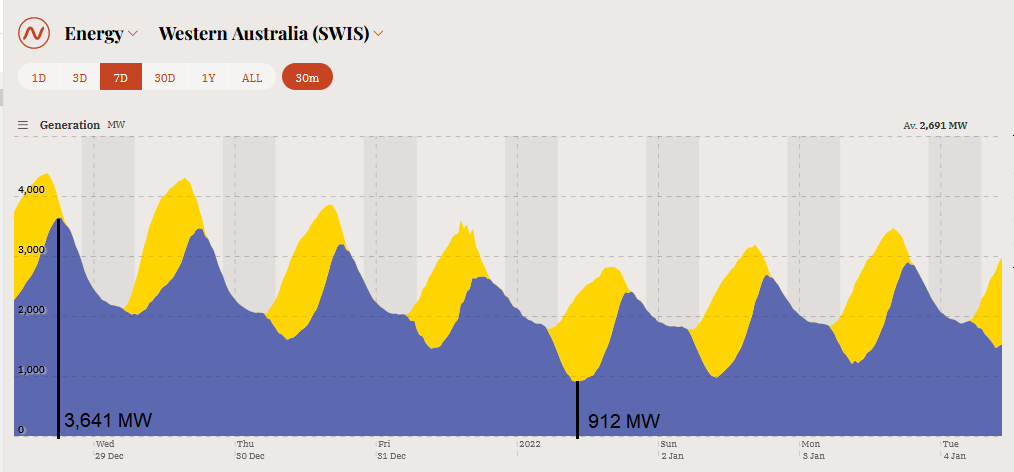
7 day operational demand plus solar on the SWIS
Image supplied from the Open NEM/Open Electricity website
Nuclear Energy in Western Australia – solves low carbon, low cost and grid stability needs.
Small Modular Reactor Option
A small self contained grid such as the SWIS is suited to a fleet of smaller reactors in the sub 300MW class such as General Electric’s BWRX 300 SMR. A fleet would overcome the impacts of refuelling or reactor trips and would mean that the grid would require less extensive upgrades and energy storage can be avoided.
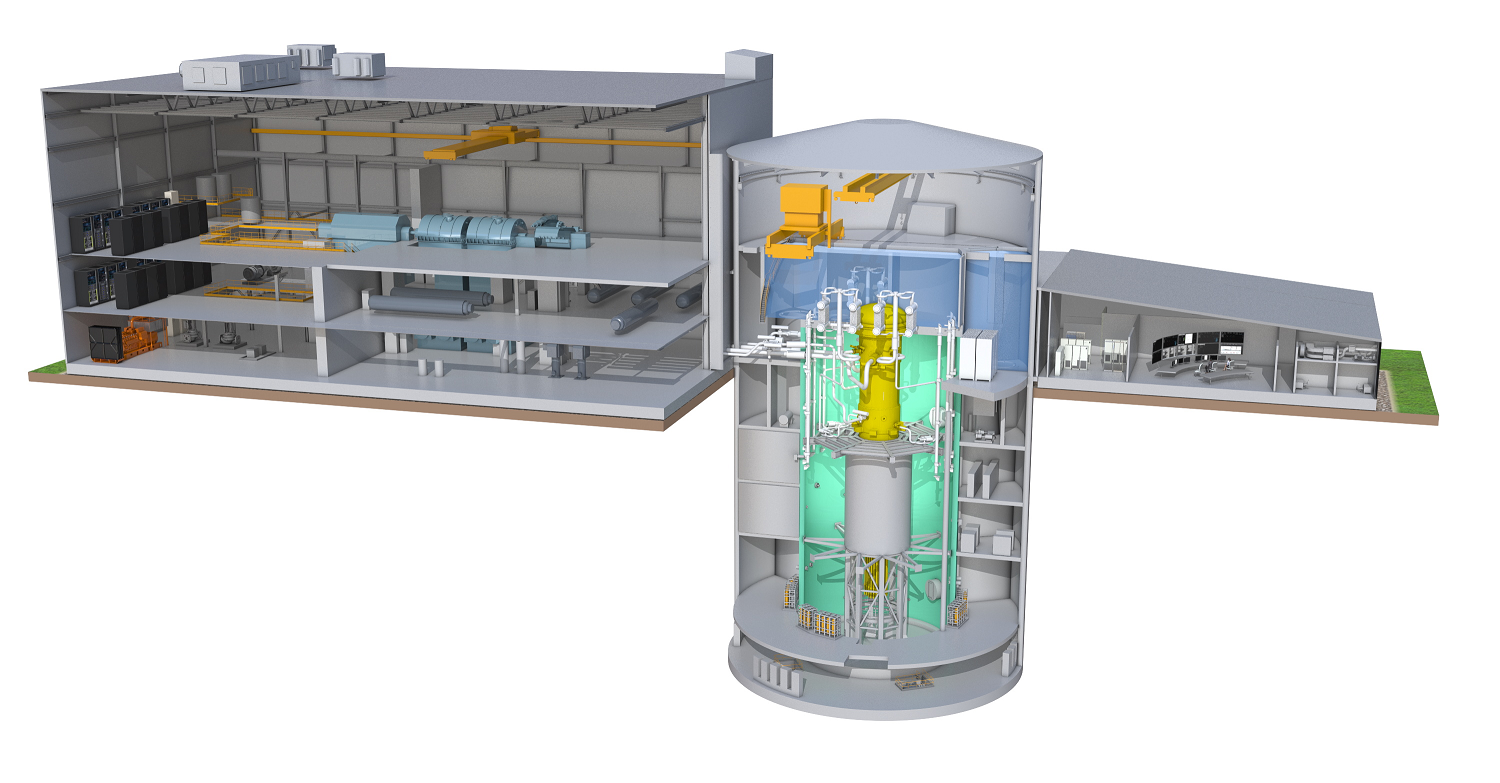
General Electric BWRX 300 small nuclear power planst
Concept for Small Nuclear Power Plants (SMR’s) on the SWIS
Small nuclear power plants would operate together with roof top solar and utlity PV and gas plants.
Key issues that affect the amount of capacity for each type of generator are:
- Need to ensure about 4,000MW of dispatchable synchronous generation is available at all times to guarantee supply should VRE fail, a nuclear power plant trips and to have reserve capacity for plant refueling and maintenance.
- Use 7 x BWRX 300 plants with a fleet maximum output of 1,960MW operating at an overall capacity factor of 79%. Assumed minimum fleet output to be 980MW.
- Limit roof top solar to 1,500MW to maintain grid stability and ensure at least 700MW of synchronous generation is available.
- Small nuclear power plants can load follow however, while technically feasible it is not economically sensible to do so. Therefore operate at a desirable minimum synchronous nuclear output of around 1,200MW. The overall nuclear fleet capacity factor of 79% is achieved by limiting solar PV capacity.
- Curtail wind power by allowing for natural attrition. The variability of wind creates a high demand for peaking gas backup and prevents economic low carbon electricity generation.
- Maintain approximately 2,040MW of peaking gas plants which, combined with 1,960MW of nuclear capacity provides sufficient synchronous generation.
Tabulation of System performance where nuclear energy is included
| Annual Load | Solar RT | Solar UT | Nuclear | Gas |
| GWh | GWh | GWh | GWh | GWh |
| 20,265 | 2,642 | 370 | 13,490 | 3,763 |
| 100% | 13% | 2% | 67% | 19% |
| System Capacity | MW | MW | MW | MW |
| 5,706 | 1,500 | 190 | 1,960 | 2,056 |
| Capacity Factors | 0.20 | 0.22 | 0.79 | 0.21 |
| Emissions | ||||
| gr CO2e/kWh | gr CO2e/kWh | gr CO2e/kWh | gr CO2e/kWh | gr CO2e/kWh |
| 139 | 85 | 85 | 12 | 637 |
| Tonnes CO2/yr | Tonnes CO2/yr | Tonnes CO2/yr | Tonnes CO2/yr | Tonnes CO2/yr |
| 2,816,412 | 224,570 | 31,450 | 161,880 | 2,398,512 |
Locations for small nuclear power plants on the SWIS
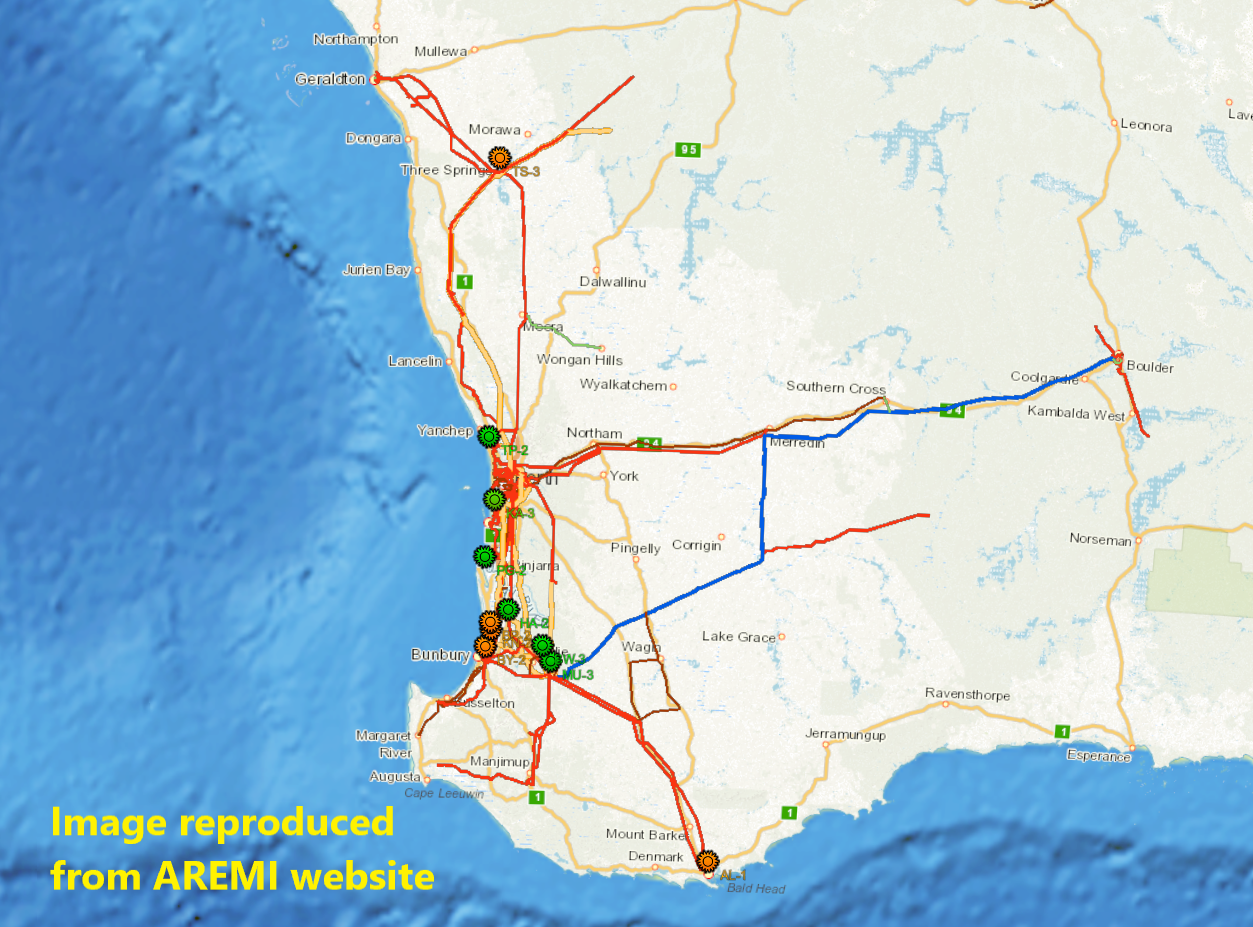
This image of the Western Australian Grid was provided by AREMI – The Australian Renewable Energy Mapping Infrastructure Project. The potential niclear power plant sites have been placed on this image
Tabulation of small nuclear power plants on the SWIS
While seven small nuclear power plants are required this preliminary overview has identified at least eleven locations for 24 individual small nuclear power plants. They are categorised along the lines of a “probables” and “possibles” basis based on site selection criteria such as grid connection, cooling resources and population densities.
| Site | Location | Number of SNPP’s | Cooling |
| Probables | |||
| KA – 3 | Kwinana | 3 x 300MW | Ist pass from sea |
| TP – 2 | Tamala Park | 2 x 300MW | Ist pass from sea |
| PG – 6 | Point Grey | 2 x 300MW | Ist pass from sea |
| HA – 2 | Harvey | 2 x 300MW | Evaporative and Hybrid |
| BW – 3 | Bluewaters PP | 3 x 300MW | Evaporative and Hybrid |
| MU – 3 | Muja PP | 3 x 300MW | Evaporative and Hybrid |
| Total | 15 x 300MW | ||
| Possibles | |||
| BP – 2 | Binningup | 2 x 300MW | Evaporative and Hybrid or sea |
| TS – 2 | Three Springs | 2 x 300MW | Evaporative and Hybrid |
| AL – 1 | Albany | 1 x 300MW | Ist pass from sea |
| BY – 2 | Bunbury | 2 x 300MW | Evaporative and Hybrid or sea |
| KN – 1 | Kemerton | 2 x 300MW | Evaporative and Hybrid or sea |
| Total | 9 x 300MW |
Emissions benefits of Nuclear compared to current system with renewables, coal, wind and gas
The emissions levels achieved by using seven small BWRX 300 nuclear power plants combined with solar PV and gas will drop from the existing levels of about 540 gr CO2/kWh to about 139 gr CO2/kWh.
The system still has 19% of energy coming from peaking open cycle fossil burning methane plants. The following image shows the comparative benefits of including nuclear energy compared with the current system.
Its highly desirable to achieve emissions intensities below 50 gr CO2/kWh to meet the challenge of man made global heating.
Options to achieve this target on the SWIS include:
- Construct energy storage either using batteries or pumped hydro. The use of nuclear energy enables the amount of storage to be limited to providing the evening “shoulder” demand and so storage durations of around 4 to 6 hours would be reasonable. Multi day, weekly and monthly energy shifts would not be required.
- Introduction at a later stage of nuclear power plants designed for larger ranges of load following such as the NATRIUM plant that’s being constructed by Terrestrial/GE in Wyoming. Here the NATRIUM plant is replacing existing coal fired generators and giving the coal workers opportunities for new careers.
WA electricity emissions intensity in 2021 compared to a nuclear energy option
Cooling WA Nuclear Plants
In Western Australia coal fired plants were constructed adjacent to available coal mines and other infrastructure.
New nuclear plants will where possible take advantage of the resource used for cooling at these plants.
In an effort to reduce the environmental impact upon inland water resources, modern nuclear power plants are being designed to use a hybrid system of air and water cooling. During periods of low water availability the degree of air cooling can be increased though at a modest reduction in power output.
At coastal plants such as those in the Geraldton, Perth and Albany regions, sea water would be the sole form of cooling.
The tabulation shows the anticipated type of cooling at each plant
Western Australia’s long coastlines provide many options for locating nuclear power plants
While recirculating systems don’t add heat to the river or lake, they do consume water through evaporation. In Western Australia the availability of sizeable inland rivers are limited and so to overcome issues surrounding temperature rises in inland locations mechanically driven systems known as hybrid and recirculating systems can be used. These are now the only option used in the United States under their EPA guidelines.
An excellent and detailed outline of the cooling options is available at: Cooling Power Plants | Power Plant Water Use for Cooling – World Nuclear Association
References
[i] https://en.wikipedia.org/wiki/List_of_power_stations_in_Western_Australia
[ii] Citation: Department of the Environment and Energy, Australian Energy Statistics, Table O, August 2018
[iii] Table 8 Sent Out Energy Forecasts, SWIS Electricity Demand Outlook, Independent Market Operator
[iv] ELECTRICITY SECTOR EMISSIONS MODELLING OF THE AUSTRALIAN GENERATION SECTOR, ACIL ALLEN April 2015
[v] PEAK DEMAND AND ENERGY FORECASTS FOR THE SOUTH WEST INTERCONNECTED SYSTEM- WESTERN AUSTRALIA ACIL ALLEN June 2019
[vi] AEMO Renewable Energy Integration – SWIS Update September 2021
[vii] AEMO Wholesale Electricity Market (WEM) Electricity Statement of Opportunities (ESOO) June 2021