
The Economics of Nuclear
The Economics of Nuclear Energy in Australia
On this previous page Our Analysis of the Grid we’ve looked at six energy scenarios and the complexities of using increasing amounts of renewables and the massive grid expansion they would require.
We’ve looked at the simplicity of a system that uses mainly nuclear energy on this page Nuclear Energy – Low Cost, Low Carbon, Reliable
In the following image we summarize the cost benefits of a system that uses nuclear energy compared to those that exclude it
IN SUMMARY< A SYSTEM THAT USES NUCLEAR ENERGY WILL COST AROUND HALF THAT OF ONE THAT EXCLUDES IT AND EMISSIONS ARE LOWER
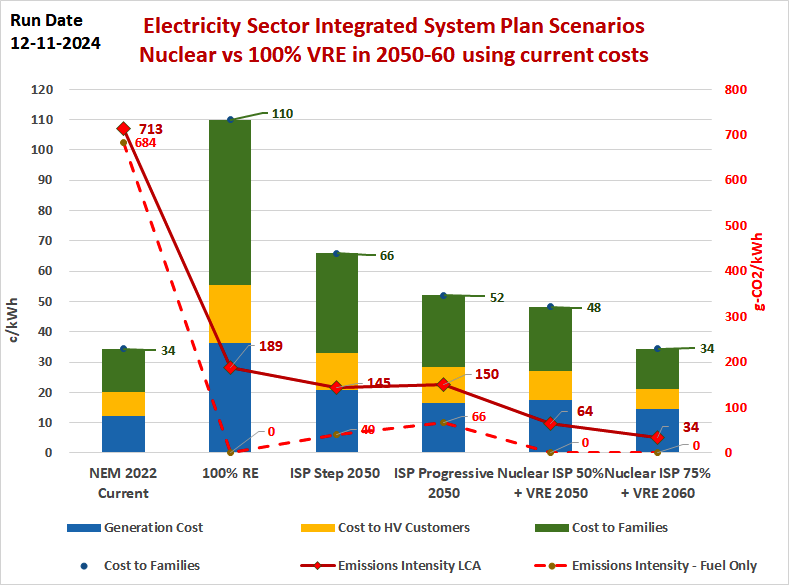
This image shows:
- Vertical scale is the cost in Cents per kilowatt hour of electricity
- In blue the base generation costs of electricity which is similar to the wholesale electricity price
- In orange we have the added increment for High Voltage customers such as major industrial and transport systems
- In green we have the added cost for Low voltage users such as general commercial and domestic customers
Six schemes are shown.
SCENARIO 1 – NEM AS AT 2022 – The first is the generation mix in 2022 which was modeled to ensure the costs used and emissions intensities would be close to the reality of both our wholesale electricity market and the resulting emissions intensity. Cost to low voltage customers is 34.5 cents/kWh and emissions intensity on LCA basis of 713 gr CO2/kWh and on a BFF basis is 708 g-CO2/kWh. Generation total is 200TWh/yr
SCENARIO 2 – 100% “RENEWABLES 315TWh– The second scheme is for a 100% “renewable” scenario and to be consistent with other scenarios the chosen NEM demand is 315TWh/yr. We modelled this scenario to provide advocates of 100% RE a measure of just how difficult and expensive such a concept is. This scenario has 374GW of generating capacity plus 821 GWh of energy storage coming from 77GW of storage capacity. It is a very costly concept caused by the massive overbuild in wind, solar and storage. This results in low-capacity factors of 10.2% for roof top solar, 2.3% for grid solar and 12.3% for wind.
This in turn causes causing 60% spilled energy and large increases in transmission and distribution. Cost to low voltage customers is 1,099 cents/kWh and emissions intensity is 189 gr CO2/kWh LCA coming from huge amounts of embodied emissions while combustion emissions (BFF) are zero.
SCENARIO 3 – ISP STEP CHANGE 2050 Next, we have AEMO’s Step Change scenario in 2050. Our analysis used AEMO’s published generating and storage capacities of 86GW Roof Top Solar, 55.5GW of Grid Solar, 61.3 GW of Wind, 15.3 GW of open cycle gas and 7GW of hydro. Storage power is 56.9GW and energy is 621 GWh. We found these resources provided 315TWh/yr and not AEMO’s stated 417TWh/yr. This discrepancy has been raised with AEMO by Dr Barr but the cause has not been resolved. It may be that AEMO assume major loads adjust to a new paradigm of demand conforming to power availability regardless of the consequential costs to industry and commerce and that no curtailment actually occurs. Cost to Low voltage customers is 66 cents/kWh and a moderate emissions intensity of 145 gr CO2/kWh Life Cycle Analysis (LCA) basis and 40 g-CO2/kWh for Burned Fossil Fuels (BFF)
SCENARIO 4 – ISP PROGRESSIVE CHANGE. The fourth scenario is the less ambitious AEMO Progressive scenario in 2050. Our analysis used AEMO’s published generating capacities of 43GW Roof Top Solar, 39GW of Grid Solar, 50GW of Wind, 14GW of open cycle gas and 7GW of hydro. Storage power is 27GW and energy is 615 GWh. We found these resources provided 255TWh/yr and not AEMO’s stated 306TWh/yr. This discrepancy has been raised with AEMO by Dr Barr but the cause has not been resolved. Cost to Low voltage customers is 52 cents/kWh and a moderate emissions intensity of 122 gr CO2/kWh Life Cycle Analysis (LCA) basis and 34 g-CO2/kWh for Burned Fossil Fuel (BFF)
SCENARIO 5 – NUCLEAR ISP 50% + RE The fifth scenario generates 50% nuclear energy. The costs of operation of the nuclear power plants increases by having to operate with solar energy and wind thereby reducing their capacity factors to 81%. This scenario has a total generating capacity of 171GW and storage power of 23.8GW with stored energy of 465GWh. Cost to low voltage customers is 48 cents/kWh. and an ultra-low emissions intensity of 64 gr CO2/kWh LCA basis and 0 g-CO2/kWh for BFF
SCENARIO 6 – NUCLEAR ISP 75%+RE Finally the best cost and emissions performance comes from the 75% nuclear energy scenario This mimics the levels of the French nuclear fleet with its proven emissions reduction. The costs of operating the nuclear power plants are still elevated by having to operate with solar energy thereby reducing their capacity factors to 81%. This scenario has a total generating capacity of only 70GW and storage power of 10.9GW with stored energy of 373GWh. Cost to low voltage customers is 34 cents/kWh. and an ultra-low emissions intensity of 34 gr CO2/kWh LCA basis and 0 g-CO2/kWh for BFF
| 2,706 |