

Nuclear Plan for the NEM – Low Cost, Low Carbon, Reliable
Edition 7 1/07/2026
Nuclear Energy – vital for low cost, reliable, low emissions energy
On this page we outline a proposed timeline for the roll out of a nuclear energy plan as shown in the following figure – A Nuclear energy Transition for the NEM 2023–2060. This is the optimum RP6 scenario.
On this previous page Analysing Our Electrical Energy Options we established that nuclear energy is our lowest cost, ultra low carbon option for the National Electricity Market –
With the election of the current government in May 2025, electrical energy policy is assumed to follow the objectives of the Australian Energy Marketing Operator’s (AEMO’s) Integrated System Plan (ISP) (Progressive Change option). Analysis by Nuclear for Climate Australia using Electric Power Consulting’s Energy Model shows that this will lead to more expensive electricity in the long term. It will also be a system whose carbon emissions are five times higher on a Life Cycle Analysis (LCA) basis than a system that incorporates significant amounts of nuclear energy.
The goal of a renewables only electricity system is now recognised as unachievable in the foreseeable future. This leads to the inevitable reliance on gas to fill in the gaps in renewable generation and to stabilise the system. it is therefore time to again consider the role of nuclear in bringing down both the cost and the emissions footprint of the power system.
The assumed NEM load in 2050 is 260 TWh/yr and in 2060 is 300 TWh/yr. This approximates to the AEMO Progressive Change Scenario and is based on anticipated population growth plus electrification of our motor vehicle fleet and increased industrial electrification.
Load, Population and Nuclear Energy Generation
In the following Figure 1 we compare population growth with electricity demand and the growth in nuclear energy from our modelling. This shows the first nuclear energy to be available after 2039. Load and population match each other and the population growth is taken from the Australian Bureau of Statistics.
The nuclear generation curve is taken from the Nuclear for Climate’s RP6 Energy plan with first nuclear energy being produced from a 300MW small nuclear plant likely located in South Australia. Note that this analysis applies only to the National Electricity Market (NEM) and does not include the Western Australia SWIS or any other Western Australian loads.
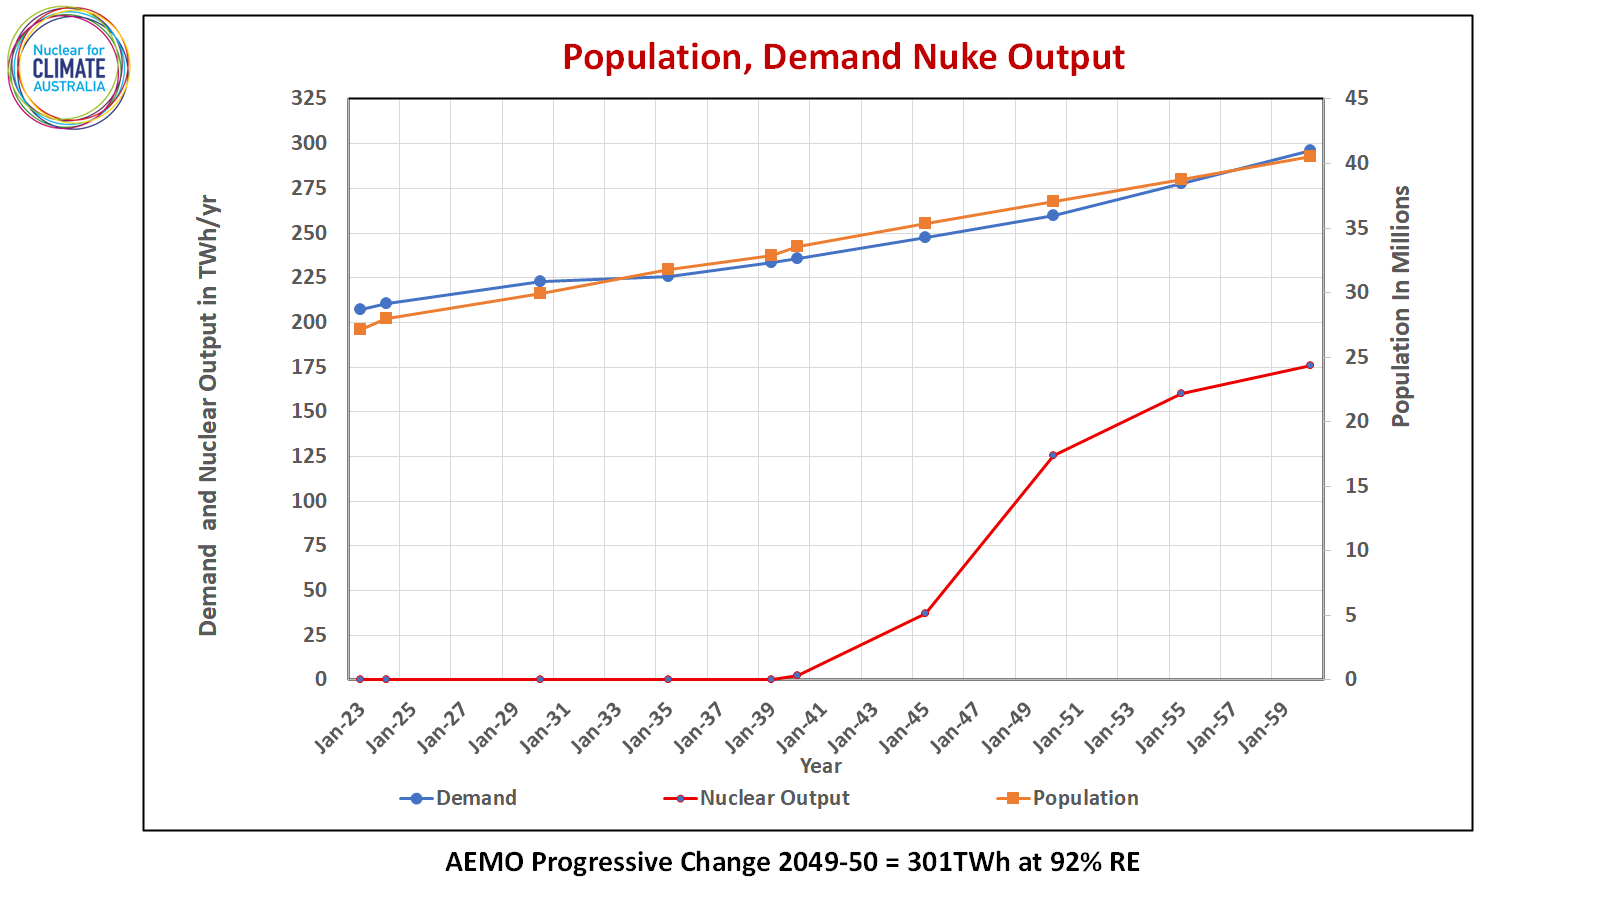 Figure 1 – Population matched to electricity demand and increase in nuclear output
Capacity and Load Mix
In response to the current government’s wind and solar expansion policy it is assumed that the wind and solar resources planned through to 2030 will be built, i.e. three years of the current term plus a two-year overhang of contractually approved projects. These resources are taken from the 2024 AEMO Progressive Change Scenario for 2030. After that, utility solar increases modestly through to 2045 to match the introduction of nuclear energy and storage. These resources are then modelled in ten model runs covering 2023, 2024, 2030, 2035, 2039, 2040, 2045, 2050, 2055 and 2060.
The results of the modelling are shown in Figure 4 – Energy Output from modelled years. The mix of generator capacity and storage power capacity is shown in Figure 3 – Generation and Storage power Capacity values in the RP6 plan. Note that while the installed “nameplate” capacity of nuclear energy shown in green in Figure 3 is small compared to wind and solar the impact of its output as shown in Figure 4 is huge. This leads to a grid with ultra-low carbon emissions, low system cost and a tiny environmental footprint
Relevant parameters are:A proposed timeline
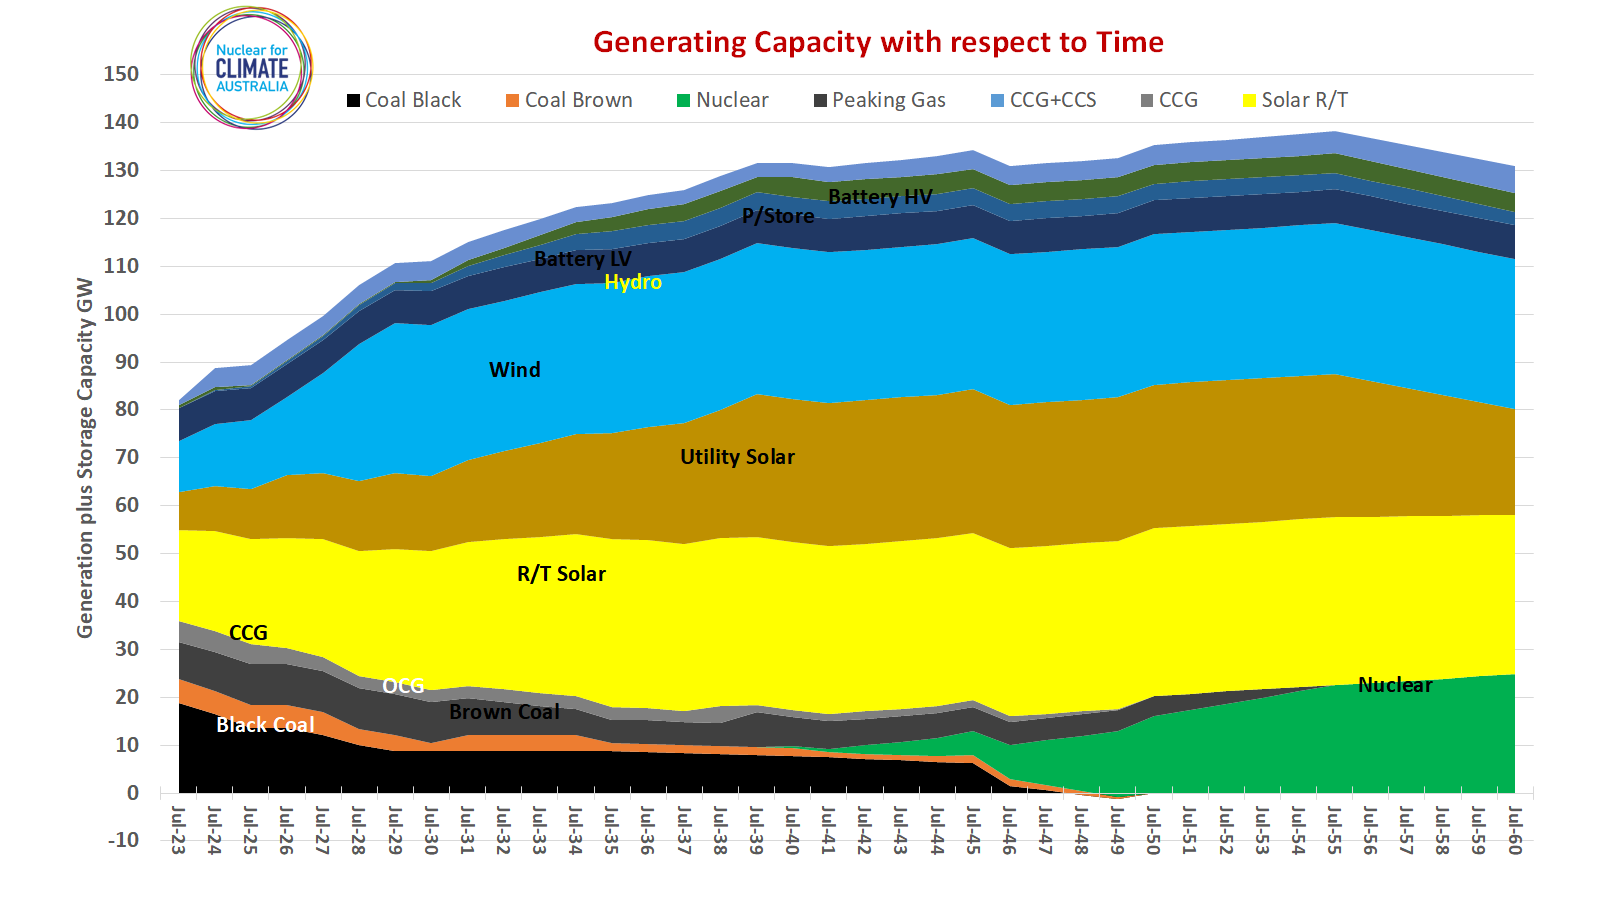 Figure 2 – Generation and Storage power Capacity values in the RP6 plan
Legend: WRT – With Respect to Time, P/Store – Pumped Storage, LV – Low Voltage, HV – High Voltage, CCG – Combined Cycle Gas generator, OCG – Open Cycle Gas generator, R/T Solar – Roof Top Solar, Solar UT – Utility Solar
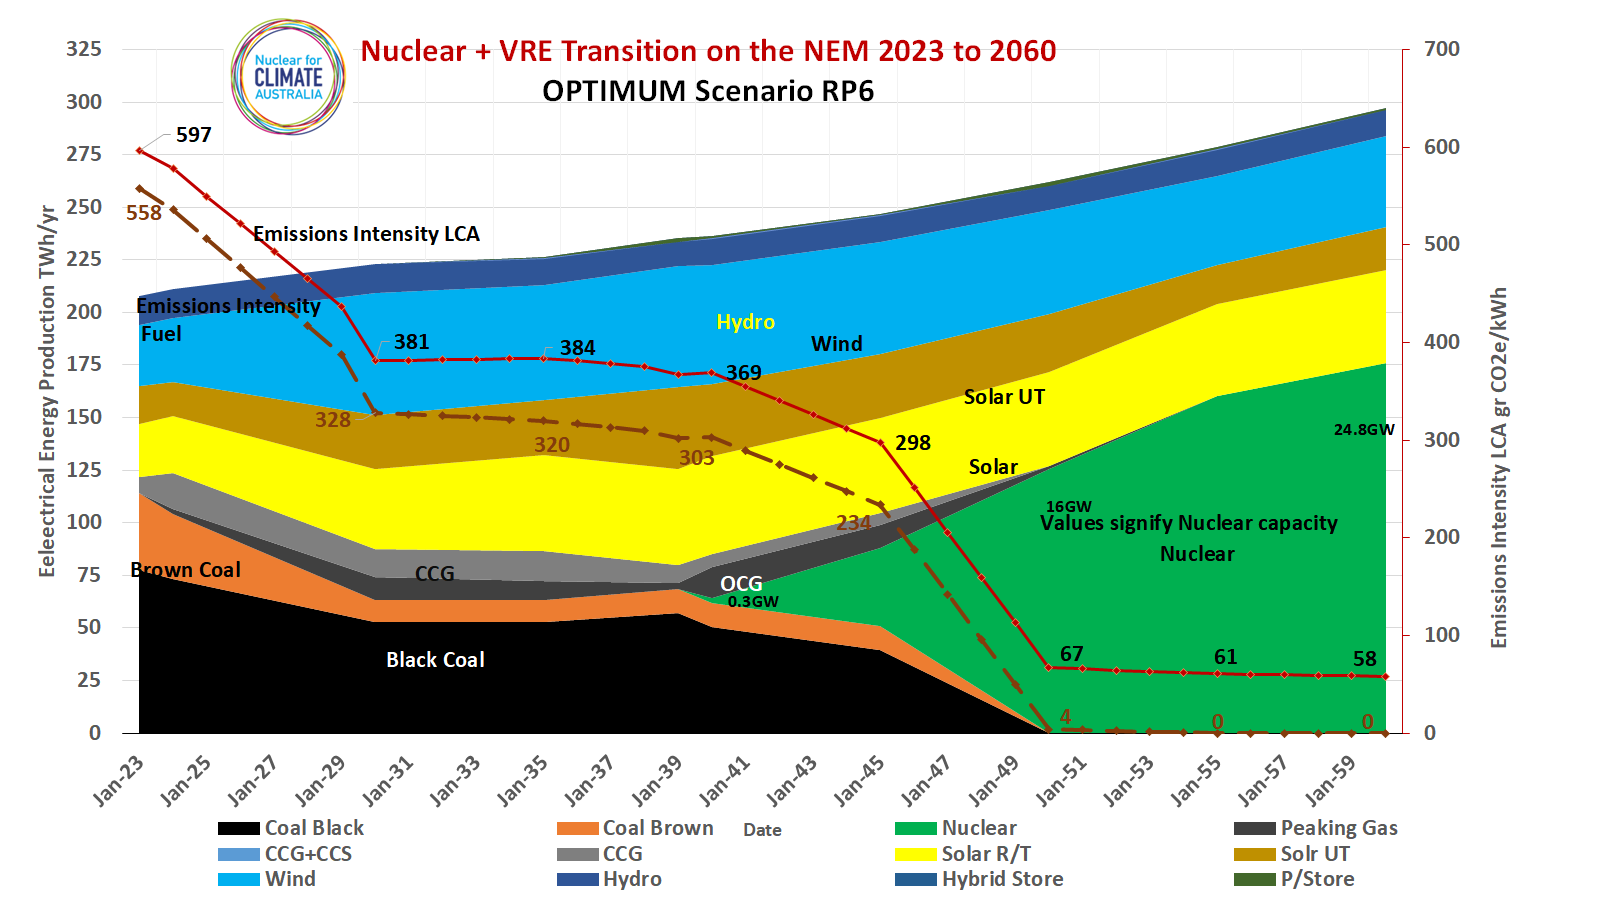
Figure 3 – Energy Output from modelled years
Legend: GW – Gigawatts, VRE – Variable Renewable Energy, LCA – Life Cycle Analysis, TWh/yr – Terawatt Hours per year,
Description of the Plan
The nuclear energy plan evolves to achieve in 2050 and 2060 a mix of renewables and nuclear energy in the following capacities and proportions
2050 2060
Nuclear 18GW 48% 24.8GW 60%
Roof Top Solar 35GW 17% 33.3GW 14%
Grid Solar 30GW 10% 22.1GW 7%
Wind 31.4GW 19% 31.4GW 14%
Hydro 7.05GW 5% 7.05GW 5%
Gas OCG 4.3GW 1% 0GW
Total Energy 260TWh 296TWh
Emissions
BFF g-CO2/kWh 4 0
LCA g-CO2/kWh 67 58
A detailed breakdown of capacities and outputs for all generators and storage devices is contained in the following Excel File
RP6 text – Capacites and Energy outputs
Capacity by State
The total electrical energy generation and nuclear capacities outlined Table 1 and Table 2 are split across the states based on existing load shares. The two tables reflect the use of proven large South Korean 1.05GW or 1.4GW nuclear units respectively. Eight Gen III+ APR 1400 units have been completed, four in South Korea and four in the UAE. Another four are under construction in South Korea and two about to start construction in the Czech Republic. Commercially they have a very clear pathway to commercial success with a reliable, vertically integrated supply chain. South Australia is limited to the use of 300MW smaller nuclear units.
Our focus is on the use of these large nuclear power plants to obtain the greatest economy of scale. For the foreseeable future, small nuclear power plants of about 300MW will be significantly more expensive per unit of output because:
- They have a higher proportion of cost involved in on-site custom built construction
- The energy density of the mass of components in the nuclear island is lower. This is especially true in the case of NuScale.
- More units on more sites are required compared to large plants. This drives up the costs of access to sites, grid connections and safety related controls such as site security and used nuclear fuel handling.
Promotion of “SMR’s” for grid connection is an unfortunate diversion from the prompt implementation of nuclear energy on the National grid though they may have some merit in Western Australia and South Australia.
Table 1 Split of nuclear capacity in each state using APR1000 plants
| State | Total generation
TWh/yr |
Percentage excl TAS | Approx GW nuclear capacity in 2050 | Number of reactors in 2050 at 1.05GW/unit | Approx GW nuclear capacity in 2060 | Number of reactors in 2060 at 1.05GW/unit |
| NSW | 74.2 | 36% | 6.9 | 7 | 9.2 | 9 |
| VIC | 52.7 | 26% | 4.6 | 4 | 7 | 6 |
| QLD | 64.7 | 31% | 4.6 | 4 | 8 | 8 |
| SA | 15.0 | 7% | 0.6 | 2 | 0.6 | 2 |
| 206.6 | 100% | 16.76 | 16 | 24.8 | 25 | |
| Installed capacity | 16.35GW | Installed capacity | 24.75GW | |||
Table 2 Split of nuclear capacity in each state using APR1400 plants
| State | Total generation TWh/yr | Percentage excl TAS | Approx GW nuclear in 2050 | Number of reactors in 2050 at 1.4GW/unit | Approx GW nuclear in 2060 | Number of reactors in 2060 at 1.4GW/unit |
| NSW | 74.2 | 36% | 6.9 | 5 | 9.2 | 6 |
| VIC | 52.7 | 26% | 4.6 | 3 | 7 | 5 |
| QLD | 64.7 | 31% | 4.6 | 4 | 8 | 6 |
| SA | 15.0 | 7% | 0.6 | 2 | 0.9 | 3 |
| 206.6 | 100% | 16.76 | 14 | 24.8 | 20 | |
| Installed
capacity |
17.4GW | Installed
capacity |
24.7GW | |||
Note that the “installed capacity” reflects the actual number of nuclear power plants installed and will differ from the “Approx GW nuclear capacity” column.
Nuclear Integrated System Plan for Australia
In the following image we see the integration of nuclear energy operating as a baseload resources together with wind, solar hydro and energy storage.
The load in this case is for ten days in a June month with a wind drought from the 20th to 24th of the month
Model output, 10 days in June with wind drought
The nuclear generators meet the baseload demand while during the day utility and domestic solar paired with storage and hydro meets the peak demands
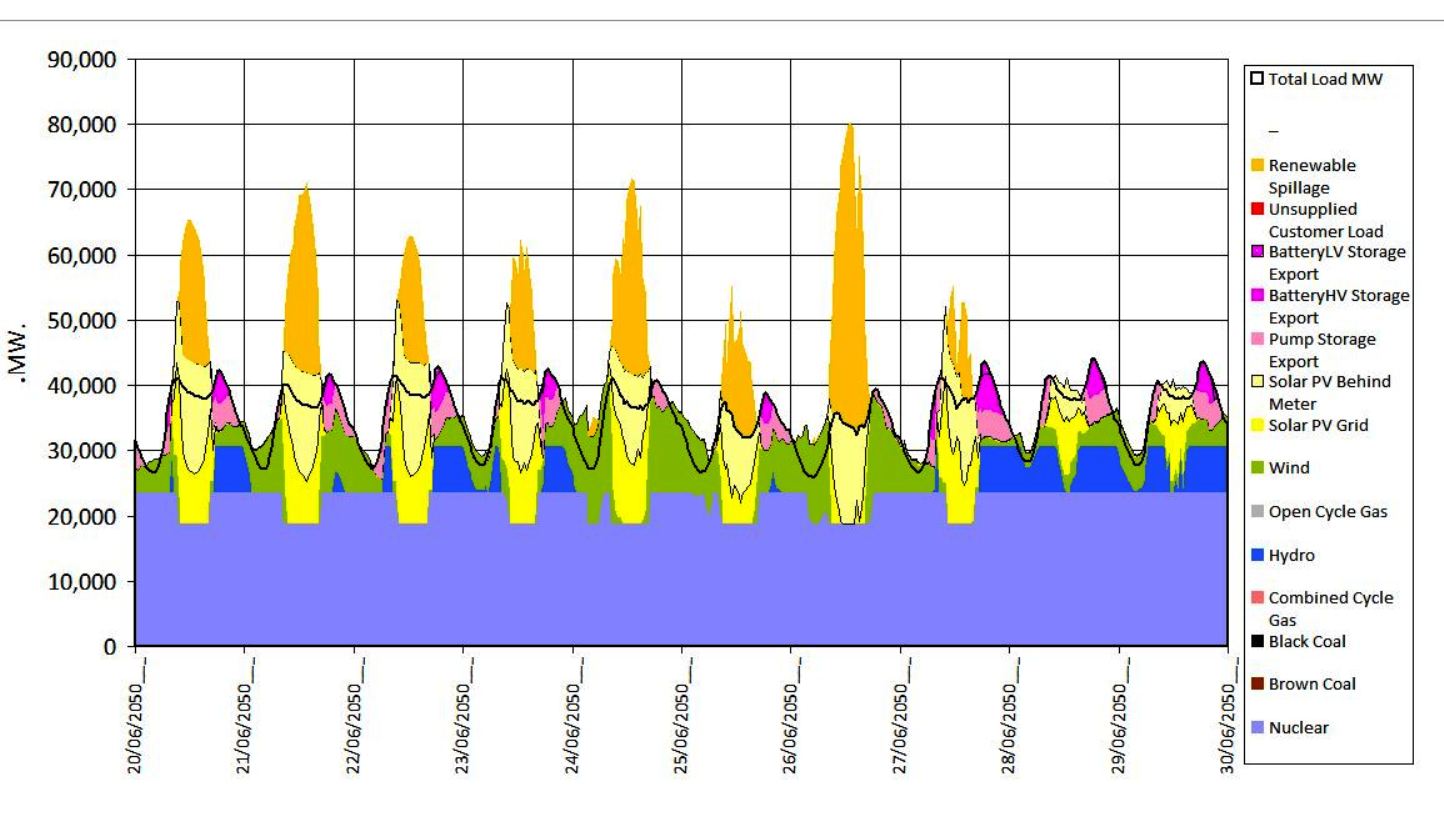
10 day energy mix in June 2060
Model Output from Electric Power Consulting Pty Ltd, Power System Generation Mix Model
Three day detailed description
In this three day image note the black demand curve.
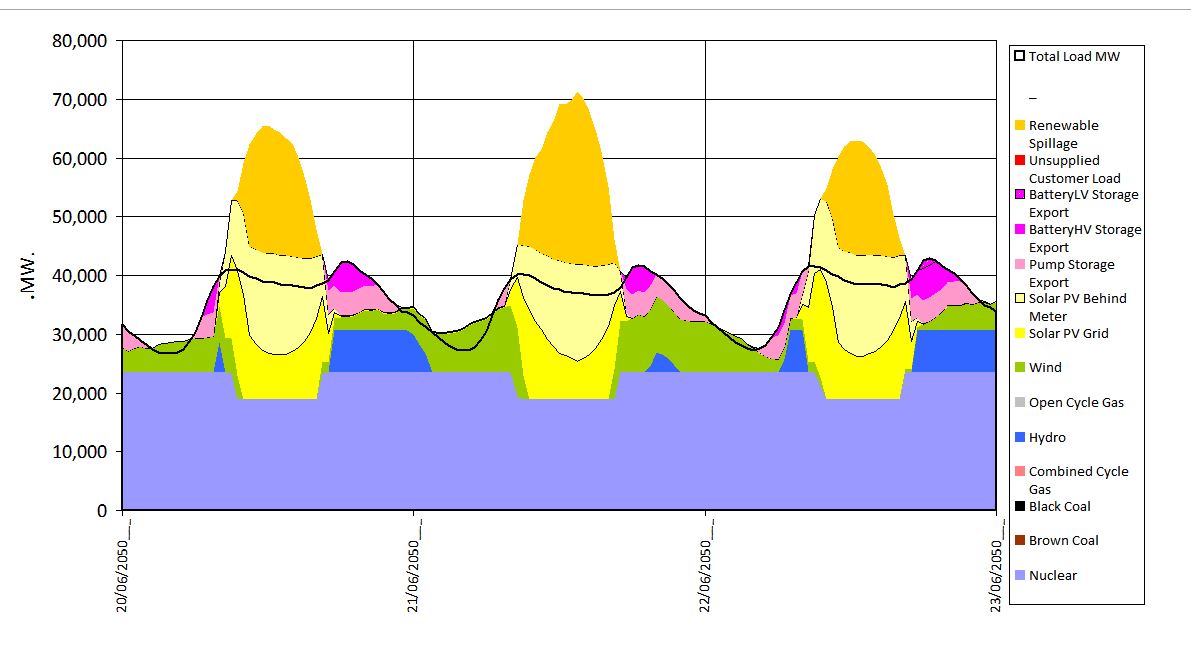
June 2060, 3 day energy mix
We see that:
- Nuclear provides 60% base load
- Solar in excess of demand goes to battery and pumped storage or is curtailed/spilled (orange colour)
- Hydro up to 5% of overall demand provides remainder
- Battery and pumped storage are operating – pink tones