A Look at Renewables
Editions 3 30/04/2023
Forest Destruction Throughout Australia with Wind Factories
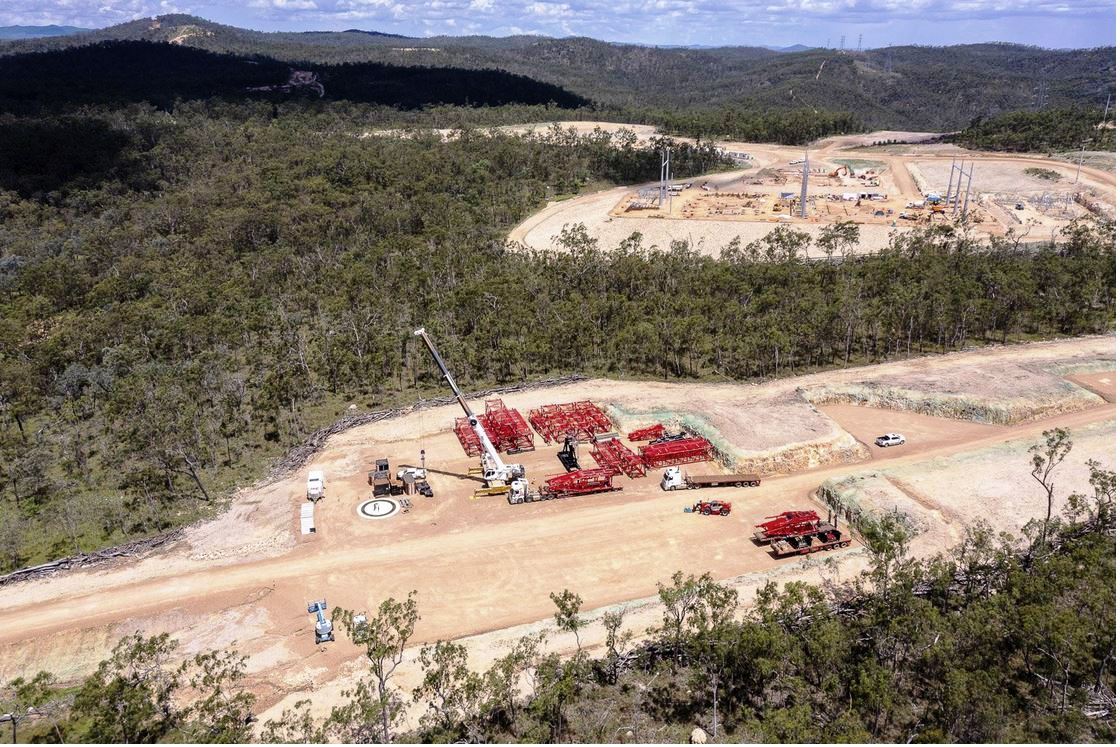
Kaban Green Power Hub – A complete change of land use: From intact Eucalypt woodland to industrial-scale renewable energy development. Heavy machinery has moved in and massive habitat clearance has ensued. 28 wind turbines are being installed here. Image taken March 2022.
Image from Rainforest Reserves Australia
AEMO is leading us to massive complexity and cost with renewables by 2050
Wind and solar gain priority access to the grid because they do not incur the full cost of supplying their energy. Costs of increased grid construction, backup generators, reserve capacity and ancillary services are not accounted for in their supply. The induced costs and inefficiencies in the coal plants may require significant subsidised costs as is currently the case in Western Australia.
AEMO Integrated System Plan Step Change Scenario 2050
The following Step Change Energy Graphic shows a ten day period in a June month. The thick black wavy line represents the traditional NEM load pattern, dark blue represents hydro, grey is gas, green is wind, pink represents battery and pumped storage and the two yellow tones represent roof top and grid solar PV. Orange above PV represents spillage/curtailment.
 Under the red arrow on the right-hand side we have a day when the system meets load with no spillage because wind output is very low. Under the left-hand red arrow wind has returned, storage is minimised and spillage is very large. This demonstrates some of the fundamental reasons why wind and solar based systems fail both emissions and cost minimisation.
These are:
- Large amounts of redundant generation and storage are required to cope with fluctuating wind and solar output. In effect we have a very large “overbuild”.
- Collapse of capacity factors caused by redundancy drives up embodied emissions especially from installed solar PV and gas backup to around 145 g-CO2/kWh. This is a mediocre emissions result and can’t be described as “low carbon”.
- Expansion of the High and Medium Voltage transmission grid has inefficient levels of utilisation due to fluctuating outputs from Renewable Energy Zones. This drives up network costs.
- Very high levels of installed battery and pumped storage have low capacity factors and very high costs and embodied emissions.
- Spillage/curtailment of 30% of generation occurs with the Step Change scenario. AEMO claim its possible to reduce this impact by sophisticated load management and price inducements however its highly dependent on behavioural change and compromised industrial demand.
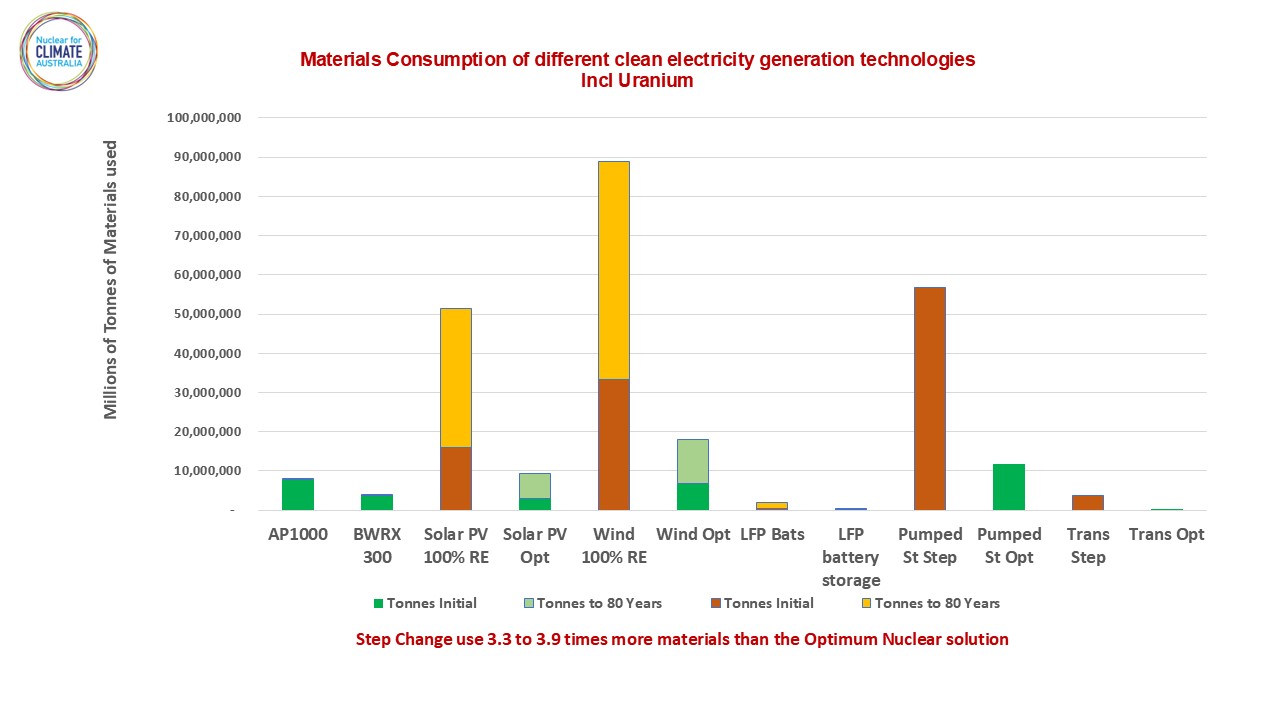
Materials Consumption of ISP Step Change Vs Nuclear Scenario
Nuclear Energy has the lowest environmental footprint of any generator – its materials consumption is really small.
In this section we deal with the highly important issue of materials consumption and sustainability:
The energy transition was intended to herald a more sustainable future however attempting to achieve this with wind and solar will only result in a massive increase in materials consumption. These materials will litter the landscape and their end of life retrieval is neither certain nor affordable.
We have compared the materials use of two scenarios each producing 315TWh/yr over an 80 year life in Table 2 – Materials used in Nuclear Energy system vs AEMO’s Step Change Scenarion. That period was chosen because it can be expected that modern nuclear power plants such as the AP1000 will last for 80 years while wind generators will last for 30 years and solar PV for 25 years.
To arrive at these values in Table 2 we used recent data from the “Updated Mining Footprints and Raw Material Needs for Clean Energy – Challenges and opportunities for managing energy transition mining impacts” by Wang, Cook, Stein, Lloyd and Smith of the Breakthrough Institute. Its available at this link:
We then applied the materials used in wind, solar, nuclear and batteries to the amount of generating and storage capacity used in the AEMO Step Change Scenarion with a comparable Nuclear Energy scheme. We used the amount of equipment required in the comparison from values obtained in scenarios modelled by Nuclear For Climate Australia and Electric Power Consulting
Advocates for wind and solar frequently claim that components from these “Renewable” schemes are recyclable. This potential is limited by the energy and cost inputs required to recycle these components especially where:
- they are located far from their place of manufacture and;
- the costs of recovery are incurred in economies that have higher labour and equipment inputs than the place of extraction, refining and manufacture.
Nevertheless the degree to which recycling can occur was handled by looking at both the initial materials load for each system with the subsequent rebuild. Even if 100% of the Wind and Solar system could be recycled its initial materials load of 191 Million tonnes is 5.1 times that of the nuclear system with 37 million tonnes.
At the end of the day, materials consumption in manufactured items is a good proxy for comparative costs. This reinforces our finding that a nuclear energy based system is ½ to 1/3rd the cost of a “Renewables” system. Given the large amounts of materials used with wind and solar it begs the question – What Does Renewable Mean?