South Australian Locations for Nuclear Power Plants
Edition 4, Revised 23/1/2022
South Australia and emissions reductions
South Australia is the poster child for renewables with its strong moves to install wind and solar generation – all aimed at reducing carbon emissions.
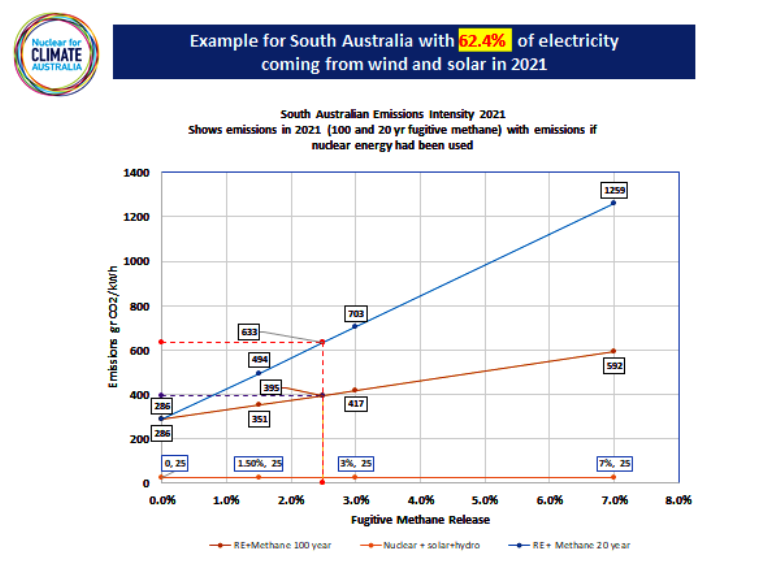
Unfortunately, despite this programme the emissions reductions are mediocre as we see in this graph.
 During 2021 the emissions intensity of electricity generated within the state plus imports was about 286 gr CO2/kWh. This is based on the emissions from combustion and embodied within the wind and solar generators.
Unfortunately that’s not the whole story due to the effect of fugitive emissions from methane burning. Australia has a poor record of measuring these amounts however a number of references consider values of around 2.5% to be appropriate.
If we refer to the graph this would correspond to an emissions intensity of around 395 gr CO2/kWh over a 100 year basis or 633 gr CO2/kWh over a 20 year time frame. That’s a bad outcome especially as we see on the same graph that if the state had adopted nuclear energy the emissions would be about 8 times less at 25 gr CO2/kWh.
The big problem with gas is that no one really knows what the emissions intensity on South Australia is. That’s true of any where where methane burners are used. It could quite conceivably be 5% leakage resulting in an emissions intensity if 500 gr CO2/kWh.
Outline of nuclear plant demand
In 2021 South Australia produced and imported 12,407 GWh of electricity not including the 2,247 GWh generated by roof top solar PV.
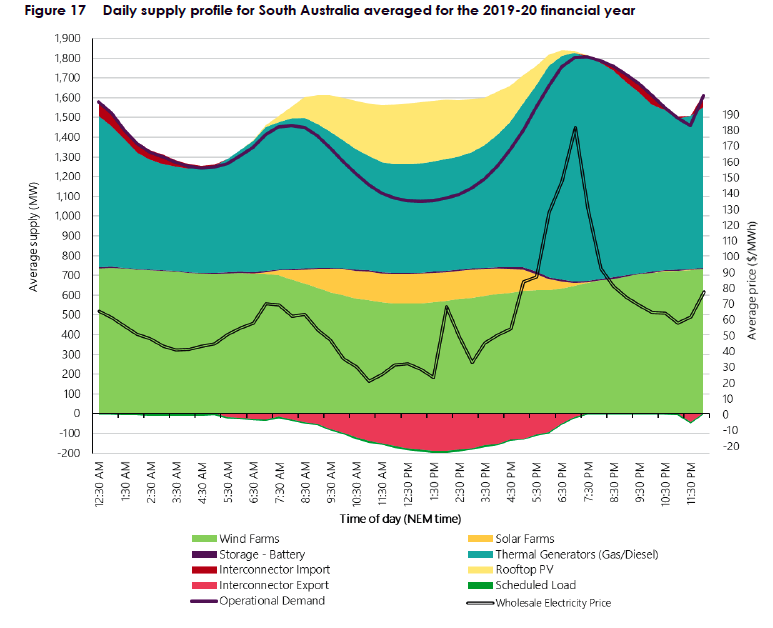
The demand profile shown in the following images taken from AEMO’s 2020 South Australian Electricity report indicates that the average evening demand of 1.300MW would accommodate five 300 MW small nuclear power plants. These would produce up to 9,688 GWh/yr or 66% of the total demand assuming 79% capacity factor.
These plants would work together with the solar PV to drive excess power produced through the day into storage to meet the evening peak demand.
Locations for Nuclear Power Plants in South Australia
The following image shows possible locations for small nuclear power plants in South Australia.
This image on this website uses a portion of the AEMO REGIONAL BOUNDARIES Map for the NATIONAL ELECTRICITY MARKET produced by AEMO. The nuclear locations have been placed over this map.
This table provides an outline of the six locations for two units at each site. This is only preliminary and many more sites could be identified that can maximise the use of the existing grid. Only five plants would be constructed at these sites.
| Site | Location | Number of SNPP’s | Cooling |
| Probables | |||
| 300MWx2(S5)PP | Pelican Point | 2 x 300MW | Ist pass from sea |
| 300MWx2(S1)CA | Caloote | 2 x 300MW | Evaporative and Hybrid |
| 300MWx2(S2)PP | Port Pirie | 2 x 300MW | Ist pass from sea |
| 300MWx2(S2)PS | Port Stanvac | 2 x 300MW | Ist pass from sea |
| 300MWx2(S2)PA | Port Augusta | 2 x 300MW | Ist pass from sea |
| Total | 10 x 300MW | ||
| Possibles | |||
| 300MWx2(S2)RB | Robertstown | 2 x 300MW | Likely Air Cooled |
| Total | 2 x 300MW |
Seismicity at South Australian sites
Nuclear facilities are rigorously designed to cope with the effects of earthquakes such that the plants are able to operate continuously during and after the Design Basis Earthquake (DBE). The profession is highly experienced in the area of seismic design and seismic response. Even during the catastrophic earthquake in Japan in 2011, the nuclear plants performed as intended—the associated tsunami was the cause of the widespread damage, not the earthquake per se.[i]
As stated on the World Nuclear Association website, the Peak Ground Acceleration (PGA) or Design Basis Earthquake Ground Motion (DBGM) is used as a measure of the size of an earthquake. It is measured in Galileo units – Gal (cm/sec2) or g – the force of gravity, 1.0 g being 980 Gal. The PGA is one measure but of course the seismic design basis for a nuclear power plant includes other parameters such as the frequency content and duration of the design earthquake, damping (energy dissipation) in the foundation media, surrounding soil or rock and the structure itself. Modern nuclear plants are designed for a standardized earthquake, and therefore, the site where the nuclear plant is constructed must have a seismic hazard level enveloped by the standardized design.
Typically nuclear power plants are designed for a PGA of 0.3g. This PGA is significantly higher than the seismic hazard level expected for sites in South Australia.

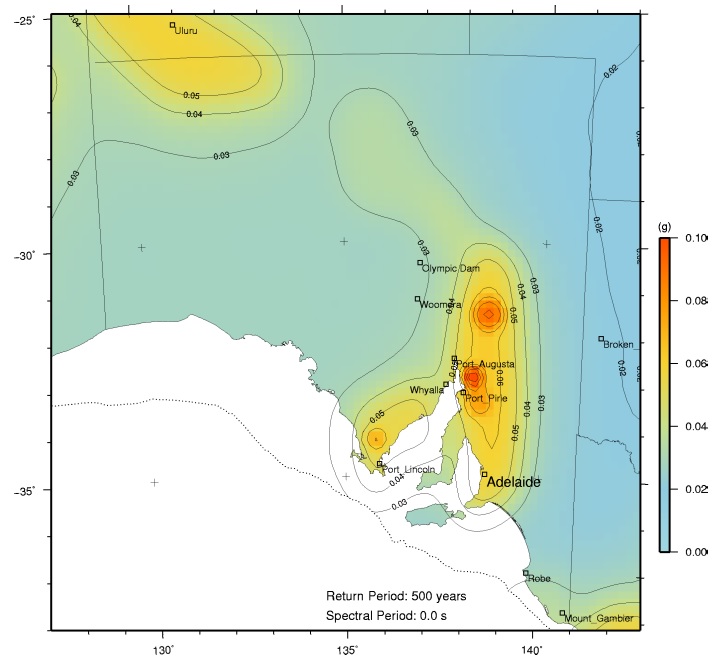
Figure 2 – The hazard map of South Australia with an annual probability of exceedence of 1/500 at a SA period of 0.0s (PGA).

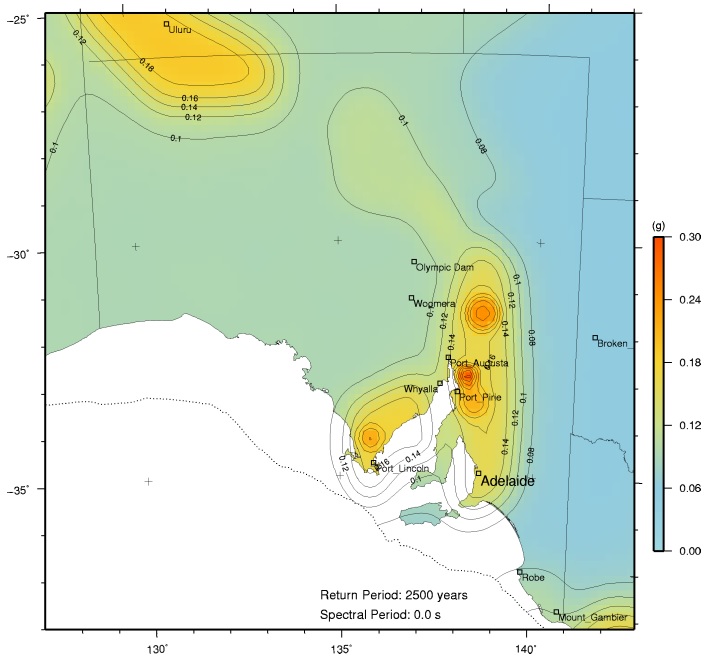
Figure 3 – The hazard map of South Australia with an annual probability of exceedence of 1/2500 at a SA period of 0.0s (PGA).
For the six site localities chosen reference is now made to the Atlas of Seismic Hazard Maps of Australia as published by Geoscience Australia[ii]. Relevant figures are shown in Figure 2 and Figure 3 which map the annual exceedence probability of peak ground acceleration for earthquakes covering these sites.
[i] http://www.world-nuclear.org/info/Safety-and-Security/Safety-of-Plants/Nuclear-Power Plants-and-Earthquakes/
[ii] Atlas of Seismic Hazard Maps of Australia Seismic hazard maps, hazard curves and hazard spectra. GEOSCIENCE AUSTRALIA RECORD 2013/41
Reactor seismic capacity versus South Australian probability
Typical power reactors that could be deployed in the near term are now listed and for two of them we have design basis earthquake (DBE) capacities.
- The BWRX 300 Small Nuclear Power Plant from GE uses a peak ground acceleration of 0.3g
- The AP1000 NPP safe shutdown earthquake design is for a peak ground acceleration of 0.3g. This design exceeds the largest recorded earthquake in the UK.[iii]
- For EC6, the Design Basis Earthquake (DBE) has been increased to from 0.2g to 0.3g peak ground acceleration in the generic design.[iv]
- For the VVER 1000 there is some indication INPRO Forum, IAEA, Vienna, 19-22 November, 2013 that the DBE is 0.25g [v]
The Design Basis Earthquake (DBE) is the earthquake which the structure is required to safely withstand with repairable damage. Those systems and components important to safety must remain functional and/or operable. For design purposes, the intended use of this earthquake loading is for economic design of structures or components whose damage or failure would not lead to catastrophic loss.
We apply the values from Figure 2 and Figure 3 to the site areas selected. It should be noted that the occurrence of earthquake with a PGA lower than 0.3g will not impact the performance of functionality of the AP1000 or other reactors with the same seismic capacity. For an earthquake having a PGA equal to or greater than 0.3g, the nuclear power plant will automatically shut down with only superficial damage
In Table 1 we note that for the 1:500 and 1:2,500 yearly probability event all values are less than half of the DBE capacity of 0.3g. Using the PGA associated with a 2,500 year event, and doubling the value of the PGA to obtain an estimate of the 10,000 year event, the site-specific DBE has a PGA lower than the standardized value of 0.3g for the BWRX 300 or the AP1000 .
It should be noted that the occurrence of earthquake with a PGA lower than 0.3g will not impact the performance of functionality of the BWRX 300 or the AP1000. For an earthquake having a PGA equal to or greater than 0.3g, the nuclear power plant will automatically shut down with only superficial damage.
Table 1 – Peak Ground Acceleration values for then four sites
| Site No. | Site | 1 in 500 year | 1 in 2,500 years | 1 in 10,000 years Assumed equal to PGA2500 event x 2 |
| 1 | Upper Spencer Gulf, Port Augusta | 0.05 | 0.14 | 0.28 |
| 2 | Port Pirie | 0.07 | 0.18 | 0.36 |
| 3 | Port Stanvac | 0.05 | 0.15 | 0.30 |
| 4 | Pelican Point | 0.06 | 0.14 | 0.28 |
| 5 | Caloote | 0.05 | 0.12 | 0.24 |
| 6 | Robertstown | 0.06 | 0.15 | 0.30 |
[iii] UK AP1000 Environment Report, UKP-GW-GL-790, Revision 4 Westinghouse Electric Company LLC
[iv] Consideration of Candu and other Medium Size PWR reactors (600 to 700 MWe Class, Low Emissions Strategies and Clean Energy Development in E&E, by Tetra Tech ES for United States Agency for International Development, Dec 2014
[v] AES-2006 – new design with VVER reactor and INPRO methodology, INPRO Forum, IAEA, Vienna, 19-22 November, 2013
Cooling Nuclear Power Stations in South Australia
Four of the locations in South Australia would use once through sea water cooling. One would likely use a nubrid combination of wet and dry cooling and one would be exclusively air cooled.
Within the region south west of Port Augusta a potential site exists at Lat -32.561968 deg, Long 137.737543. This location is approximately 2km from a sea water inlet at Spencers Gulf and would require significant civil works to construct a sea water inlet/outlet for cooling. This location is directly on the route of the transmissions lines leading from switchyards at the closed Playford and Northern coal power stations.
The tabulation shows the anticipated type of cooling at each plant
An excellent and detailed outline of the cooling options is available at: Cooling Power Plants | Power Plant Water Use for Cooling – World Nuclear Association


