Queensland locations for nuclear energy
Edition 5, Revised 20/02/2025
Regions for Nuclear Power Plants in Queensland
Existing System
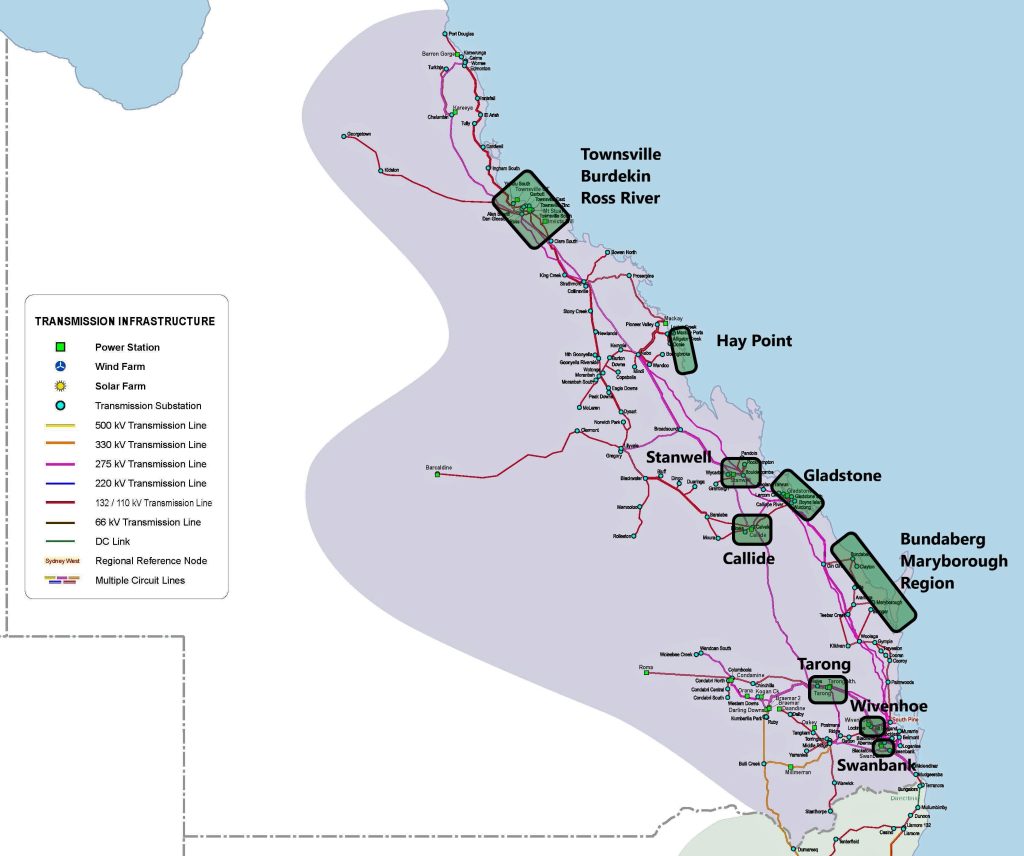
Queensland has a very long high voltage transmission grid that extends 1,700km from north of Cairns to the New South Wales border. Apart from the populated south east corner and the industrialised Gladstone region this long grid feeds a state with a low population density. This very long delicate grid presents challenges for the state and excellent opportunities for the adoption of smaller nuclear power plants.
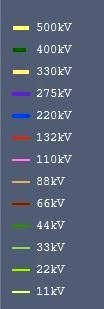
The Queensland’s electricity transmission network currently comprises 275kV transmission lines from Cairns to the southern Gold Coast, with 110kV and 132kV transmission lines providing transmission in local areas and supporting the 275kV network.
In addition, 330kV transmission lines link Queensland to the New South Wales network, allowing the flow of high voltage electricity between the two States.
A 500kV transmission network is being introduced in South East Queensland. Note that one 500kV power line is capable of carrying about the same amount of electricity as three 275kV transmission lines, with a much smaller land use requirement.
The Queensland grid and regions for nuclear power plants
The following image shows the Queensland grid together with regions that could host nuclear power plants.
This image on this website uses a portion of the AEMO REGIONAL BOUNDARIES Map for the NATIONAL ELECTRICITY MARKET produced by AEMO. The nuclear locations have been placed over this map.

Queensland Generating Capacity and Output in 2024
Queensland is Australia’s most energy hungry state on a per capita basis. Currently 72.2% of electricity generated in that state comes from fossil fuels. Even with proposed renewable energy projects the actual CO2 emissions intensity will only reduce marginally because of the poor capacity factors of wind and solar generation and the backup required from gas plants in particular.
The generating units at coal fired plants such as Stanwell, Gladstone, Tarong and Callide are not especially large being in the range of 350MW to 450MW and are matched to a 275kV transmission system.
The performance of the Queensland generating system as a whole is shown in the following table for 2024.
| Generator | Capacity (MW) | Proportion | Output (GWh) | Proportion | Capacity Factor |
| Coal | 8,130 | 64.1% | 42,867 | 65.0% | 0.61 |
| CCGT | 1,418 | 5.0% | 3,316 | 5.0% | 0.27 |
| OCGT | 1,603 | 1.4% | 919 | 1.4% | 0.07 |
| Gas CM | 2,256 | 0.7% | 438 | 0.7% | 0.02 |
| Wind | 1,018 | 4.5% | 2,933 | 4.4% | 0.33 |
| Solar Utility | 4,640 | 9.1% | 6,069 | 9.2% | 0.15 |
| Solar R/T | 6,082 | 12.7% | 8,523 | 12.9% | 0.16 |
| Hydro | 164 | 2.2% | 457 | 0.7% | 0.32 |
| Recip Eng | 189 | 0.1% | 40 | 0.1% | 0.02 |
| Hydro PS | 540 | 0.0% | |||
| Biomass | 30 | 0.3% | 217 | 0.3% | 0.83 |
| Battery | 507 | 0.2% | 144 | 0.2% | 0.03 |
| 26,577 | 100.3% | 65,923 |
Total electricity generating capacity (not including storage) in Queensland in 2024 was 25,530MW which generated 65TWh of gross electricity production[ii].
Nuclear Energy in Queensland
The Nuclear For Climate “Optimum Plan” for the NEM calls for 18GW of nuclear capacity in 2050 and 30GW by 2060. Queensland’s proportion is about 1/3 of this and would be 5.8GW in 2050 and 9.4GW by 2060.
This could be achieved by a fleet of all Small Modular Reactors or a mixed combination of SMR’s and large plants:
- Mixed Route – By 2050, four APR 1000 large plants and seven BWRX 300 small plants would provide 5.8 GW of capacity. This would increase to six large plants and 12 small plants by 2060. A mix of large and small plants has pluses and minuse.
Pluses: Large plants cost less per unit of capacity than small plants. Small plants can be placed more easily at the sites of existing coal plants or at distant locations like Townsville. They would operate more readily on Queensland’s light capacity grid. At inland sites where cooling water sources may be constrained the installed capacity of SMR’s can be deliberately downsized to minimise any impact on competing water needs.
Minuses: While large plants are lower cost per unit of capacity, all nuclear plants need to be built in multiples at each site to achieve the greatest economies.. This would therefore require construction of large plants at coastal locations and an increase in transmission capacity to convey the energy through to the major load centres.
- SMR route – twenty BWRX 300 small nuclear power plants increasing to thirty three by 2060.
Pluses: A large number of SMR’s allows for the best adaptation to Queensland light capacity grid and can be matched to limited inland cooling resources. The individual plants will be faster to build and no significant grid upgrades would be required.
Minuses: SMR’s would be more expensive per unit of output. Given the scale of the installed capacity a large number would also need to be built at coastal locations.
The need to address global warming with nuclear energy is immediate. Larger 1GW scale reactors are currently available for use in the state. However this would require grid capacity to be increased to incorporate 500kV transmission lines. Large reactors can also be used within the industrial region of Gladstone to meet the demands of the LNG plants and aluminium refineries however this would also require grid upgrades to the major load in the south east region.
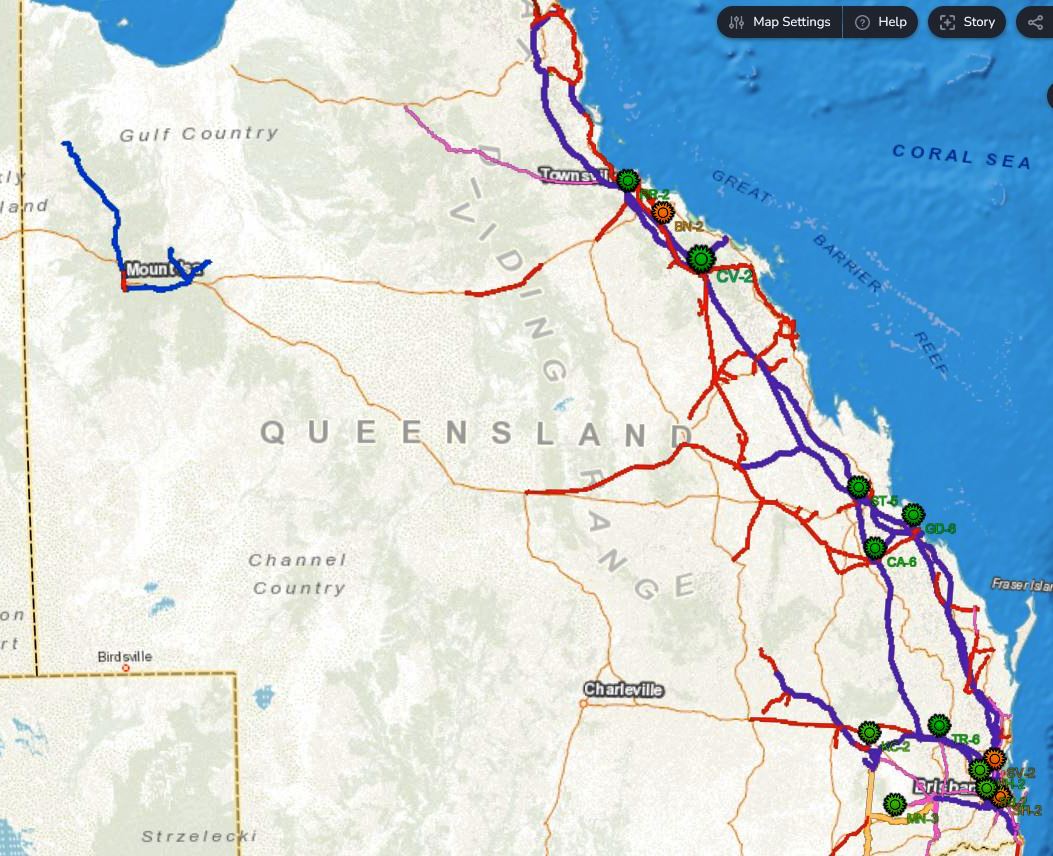
In the following image and tabulation we have included locations for some 30 small nuclear power plants that could be constructed at eleven different sites while only 20 are in fact required by 2050.


| Site | Location | Number of SNPP’s | Cooling |
| Probables | |||
| MN – 3 | Millmeran | 2 x 300MW | Evaporative and Hybrid |
| CA – 6 | Callide | 4 x 300MW | Evaporative and Hybrid |
| GD – 6 | Gladstone | 6 x 300MW | Ist pass from sea |
| RR – 2 | Ross River | 2 x 300MW | Evaporative and Hybrid |
| TR – 6 | Tarong | 4x 300MW | Evaporative and Hybrid |
| ST – 5 | Stanwell | 4 x 300MW | Evaporative and Hybrid |
| WH – 2 | Wivenhoe Dam | 2 x 300MW | Evaporative and Hybrid |
| Total | 24 x 300MW | ||
| Possibles | |||
| SV – 2 | Samsonvale | 2 x 300MW | Evaporative and Hybrid |
| BN – 2 | Burdekin | 2 x 300MW | Evaporative and Hybrid |
| SH – 2 | Stockleigh | 2 x 300MW | Evaporative and Hybrid |
| Total | 6 x 300MW |
Cooling Queensland Nuclear Plants
In Queensland coal fired plants were constructed adjacent to available coal mines and other infrastructure.
New nuclear plants will where possible take advantage of the resource used for cooling at these plants.
At Townsville and Gladstone sea water cooling will be used
In an effort to reduce the environmental impact upon inland water resources, modern nuclear power plants are being designed to use a hybrid system of air and water cooling. During periods of low water availability the degree of air cooling can be increased though at a modest reduction in power output.
The tabulation shows the anticipated type of cooling at each plant
Australia’s long coastlines provide many options for locating nuclear power plants
To overcome issues surrounding temperature rises in inland locations cooling towers or mechanically driven systems known as hybrid and recirculating systems can be used. These are now the only option used in the United States under their EPA guidelines.
While recirculating systems don’t add heat to the river or lake, they do consume water through evaporation. In Australia the availability of sizeable inland rivers are limited though a number of large reservoirs such as Wivenhoe Dam provide a substantial resource for fresh water cooling.
An excellent and detailed outline of the cooling options is available at: Cooling Power Plants | Power Plant Water Use for Cooling – World Nuclear Association
