Nuclear Energy – Low Cost, Low Carbon, Reliable
Edition 3 1/05/2023
Nuclear Energy – vital for low cost, reliable, low emissions energy
Nuclear energy on the Australian grid has three key benefits:
- It locks into place ultra low carbon emissions
- It provides energy 24 hours of the day, 7 days of the week and 365 days of the year. Nuclear power plants in the USA are currently operating with capacity factors up around 95%
- On a system levelised cost of energy basis (SLCOE) and at high levels of decarbonisation the inclusion of nuclear energy results in the lowest cost electricity provision.
There are however significant limitations when combining nuclear energy with high levels of renewables.
Wind and solar are heavily subsidised on the grid. They do not include all the costs of energy delivery such as extended grid connection costs. These costs are paid for through a separate regulated asset base and included on our bills. Further, as previously noted grid ancillary services that are provided to enable wind and solar to operate are not included in the energy market but are paid through a separate Frequency Control Ancillary Services Market (FCAS). Finally, subsidies are also levied through the Large Scale Renewable Energy Certificates which currently trade at around $41/MWh. These enable wind and solar to bid into the NEM at zero and negative prices.
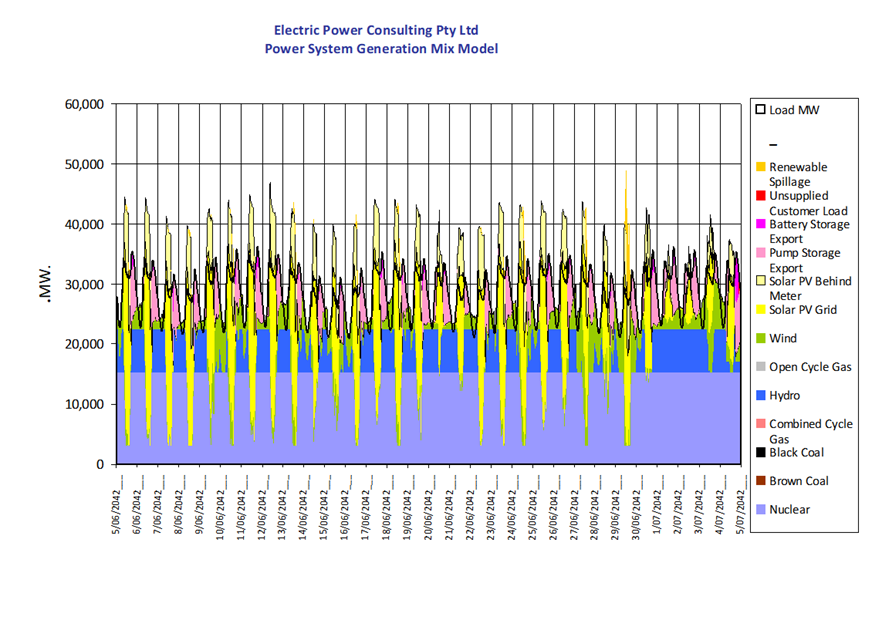
50% Nuclear with Renewables scenario
A scenario with a mix of 50% nuclear with renewables was modeled and the results are shown graphically in the following image. The impact of priority access to the grid through subsidies causes nuclear power plants to operate at low capacity factors. In this case 76%. In this scenario we are generating 243TWh/yr vs our current generation in 2023 of around 203TWh
Under the conditions of 50% nuclear operating with variable renewable energy the options are:
- Nuclear requires a Power Purchase Agreement which drives up the costs for dispatchable RE or,
- Nuclear competes with intermittent RE which drives up nuclear costs due to reduced capacity factors
Nuclear load following while possible may not be cost effective.
Nuclear Integrated System Plan for Australia
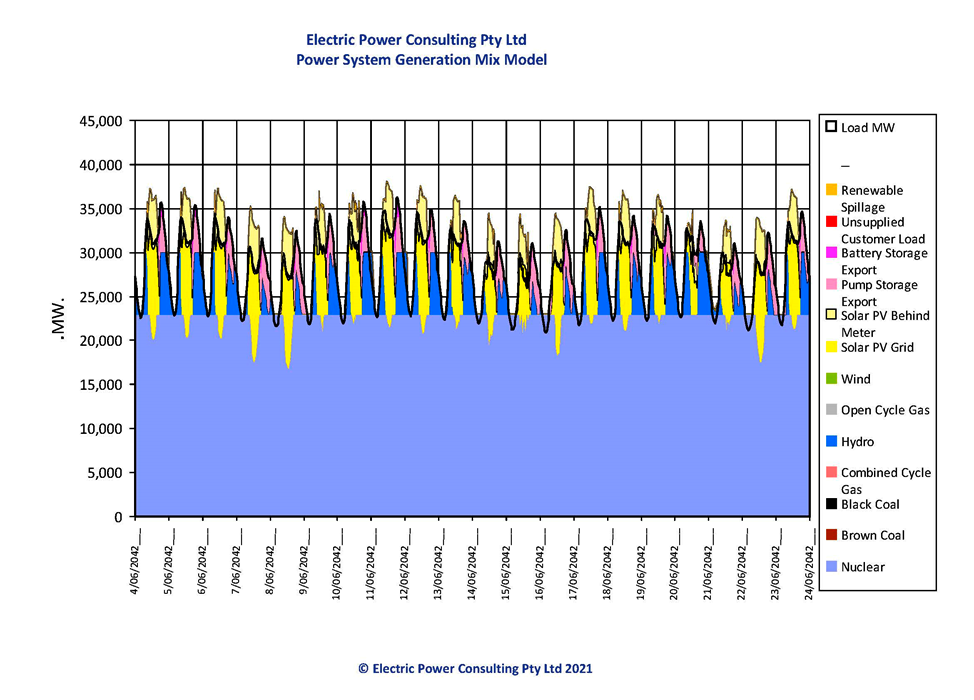
So now to a Nuclear Integrated System Plan for Australia – a high performance system. In this case its generating 243TWh/yr vs a current yearly NEM generation of about 203TWh
In this mix we have Solar Utility PV at 11%, Roof Top Solar 6%, Existing Hydro at 7% and Nuclear Energy at 76%.
Carbon emissions intensity is 22 gr CO2/kWh.
This system makes maximum use of our existing grid.
The following image shows how the generators combine to meet the total demand for electricity
 The nuclear generators meet the baseload demand while during the day utility and domestic solar paired with storage and hydro meets the peak demands
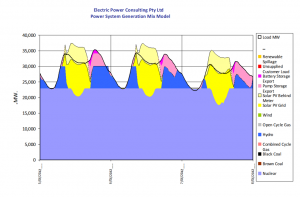
Three day detailed description
In this three day image note the black demand curve.
We see that:
- Nuclear provides 76% base load
- Solar in excess of demand goes to battery and pumped storage
- Hydro up to 7% of demand provides remainder
- Wind is not used due to high variability which requires expensive gas backup or storage


