
NSW Nuclear Power Plant locations
Edition 6, Revised 5/03/2026
Locations for Nuclear Power Plants in NSW
The New South Wales capacity proportion of the total nuclear roll out is about 36%. This requires 7 GW in 2050 and 8.4GW by 2060. This could be achieved by a fleet of large nuclear power plants located maonly on coastal locations with one exception.
By 2050, five large 1.4GW, APR1400 type plants would provide 7GW of capacity. This would increase to six large plants by 2060. Large plants have pluses and minuses.
While large plants are lower cost per unit of capacity than small plants, they need to be built in multiples at each site to achieve their greatest economies. Cooling capacity will therefore be required to suit a minimum of 2.4GW at each site.
To build 7GW of new nuclear by 2050 (and 8.4GW by 2060) would use only coastal locations plus an inland location at Bayswater/Liddell. Coastal sites will require a modest increase in transmission capacity. In the following Table 2 we have included locations and suggested capacities for nuclear power plants at four selected sites.
Table 1 Unrestricted Water Availability using APR1400 Units
| Location | 2050 | 2060 | |||
| Capacity MW | Number of Units | Capacity MW | Number of Units | Cooling Type | |
| Bayswater/Liddell | 2,800 | 2 | 2,800 | 2 | Freshwater |
| Shoalhaven/South Coast | 1,400 | 1 | 2,800 | 2 | Seawater |
| Eraring | 0 | 0 | Seawater | ||
| Central Coast | 2,800 | 2 | 2,800 | 2 | Seawater |
| Total | 7,000 | 5 | 8,400 | 6 | |
In Table 2 we provide another possible mix of sites and reactor capacities using smaller APR1000 units.
Table 2 – An alternate option with three plants at each of two locations and two units at a single location.
| Location | 2050 | 2060 | |||
| Capacity MW | Number of Units | Capacity MW | Number of Units | Cooling Type | |
| Bayswater/Liddell | 3,450 | 3 | 3,450 | 3 | Freshwater |
| Shoalhaven/South Coast | 0 | 0 | 2,300 | 2 | Seawater |
| Eraring | 0 | 0 | 0 | 0 | Seawater |
| Central Coast | 3,450 | 3 | 3,450 | 3 | Seawater |
| Total | 6,900 | 6 | 9,200 | 8 | |
![]()
Figure 1 Potential Sites for Large Nuclear Power Plants in NSW
In Figure 1 nine potential sites are shown:
- Central Coast – Birdie Beach, Frazer Beach and Baldy Cliff.
- South Coast – Kinghorn Point, Beecroft Peninsular, Jervis Bay and Mermaid near Berrara
- Existing Coal Plant Sites – Eraring and Liddell
NSW and the National Grid
Transmission and distribution currently make up the largest share of our electricity bills. In NSW its of the order of 45% while in SA its around 68%. Our analysis shows that going to 100% renewable energy with wind and solar could see this component at least double in cost.
Using nuclear power plants especially with Large Nuclear Power Plants can make huge saving on the most expensive part of our electricity bills.
Based upon the three arbitrary locations shown in Table 2 of Bayswater/Liddell, Shoalhaven/South Coast and the Central Coast the following grid upgrade are allowed for:
- Central Coast – Frazer Beach,
- 2800MW generation,
- 500kV to Vales point substation – 11kM and
- 330kV backup link – 7km.
- Transmission line and substation costs – $208 million
- Bayswater – Liddell
- 2800MW generation
- 330kV local upgrades
- Main switchyard costs in power plant budget
- Transmission line and substation costs – $80 million
- Kinghorn Point – South Coast
- 2800MW generation
- 500kV from Kinghorn Point to Marulan Sub Station – 110km
- 330kV link from Kinghorn Point to existing 330kV – 32km
- Transmission line and substation costs – $1,070 million
Capital Cost of Nuclear Power Plants and Grid Connections
The capital cost used for nuclear power plants reflects the figures quoted in CSIRO’s Gen Cost report and our evaluation of the costs of Saeul Units 3 and 4, the Barakah project in the UAE as well as tendered amounts for South Korean plants in the Czech Republic and Poland.
- Nuclear Power Plants, 8,400MW at $8,655/kW = $72.7 Billion
- Transmission and Substations – $1.36Billion
- Total Cost – $74.06Billion
Cooling NSW Nuclear Plants
In New South Wales coal fired plants were constructed adjacent to available coal mines and water resources for cooling.
New nuclear plants will where possible take advantage of the resource used for cooling at these plants however not all sites have sufficient long term cooling resources.
Its for this reason that the majority of sites such as those on the mid North Coast and South Coast are located on the coast or tidal lakes where sea water cooling is available. At the Bayswater/Liddell site in the Upper Hunter, sufficient fresh water is available from the Hunter River and other local resources.
Liddell/Bayswater Sites
Bayswater and Liddell coal fired Power Staton sites are 3.5km apart and would be retrofitted with two nuclear power plants totalling 2,300MW capacity. Bayswater is currently operational at 2,640MW capacity while Liddell at 2000 MW was shut down and decommissioned in 2023. They are located near Muswellbrook in the Hunter Valley.
Bayswater is currently scheduled to close between 2030-2033. Both plants are owned by AGL Energy.
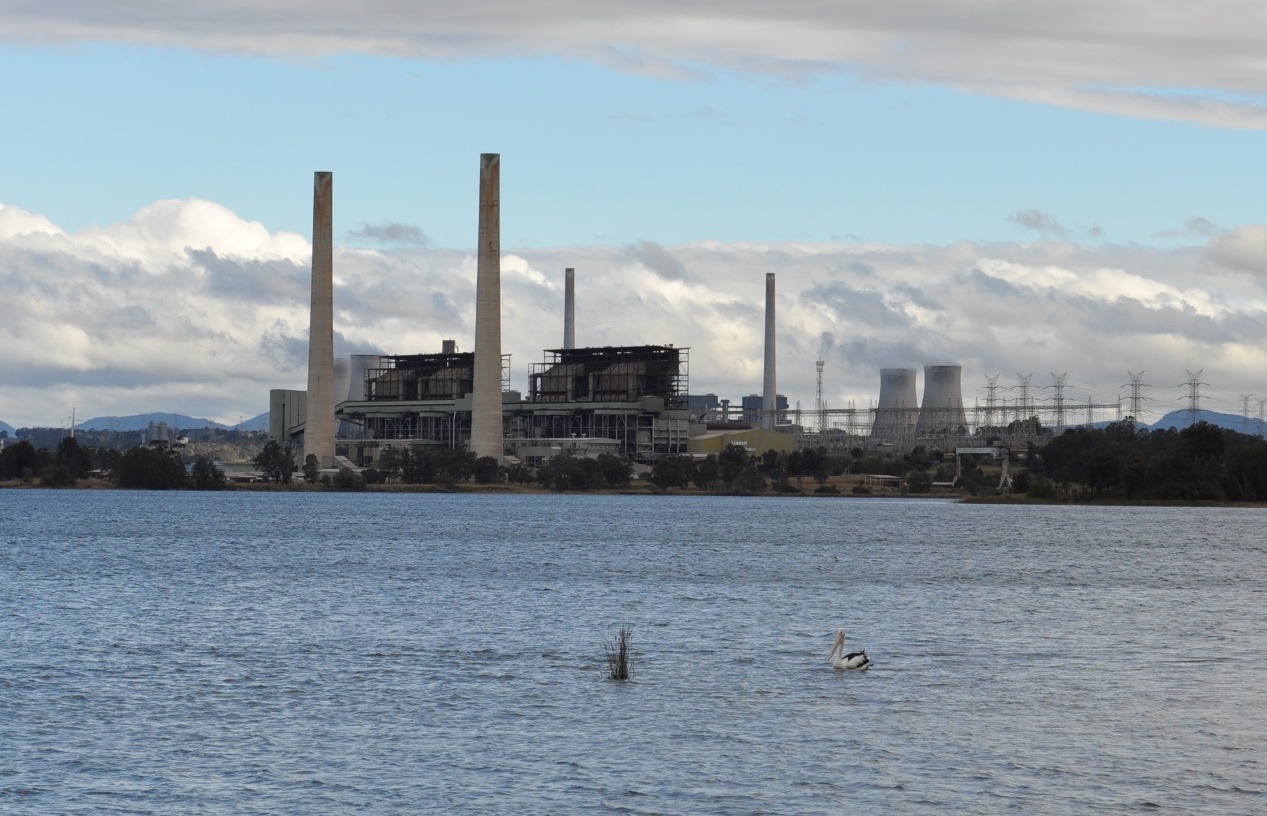
Figure 7 Liddell Power Station July 2025
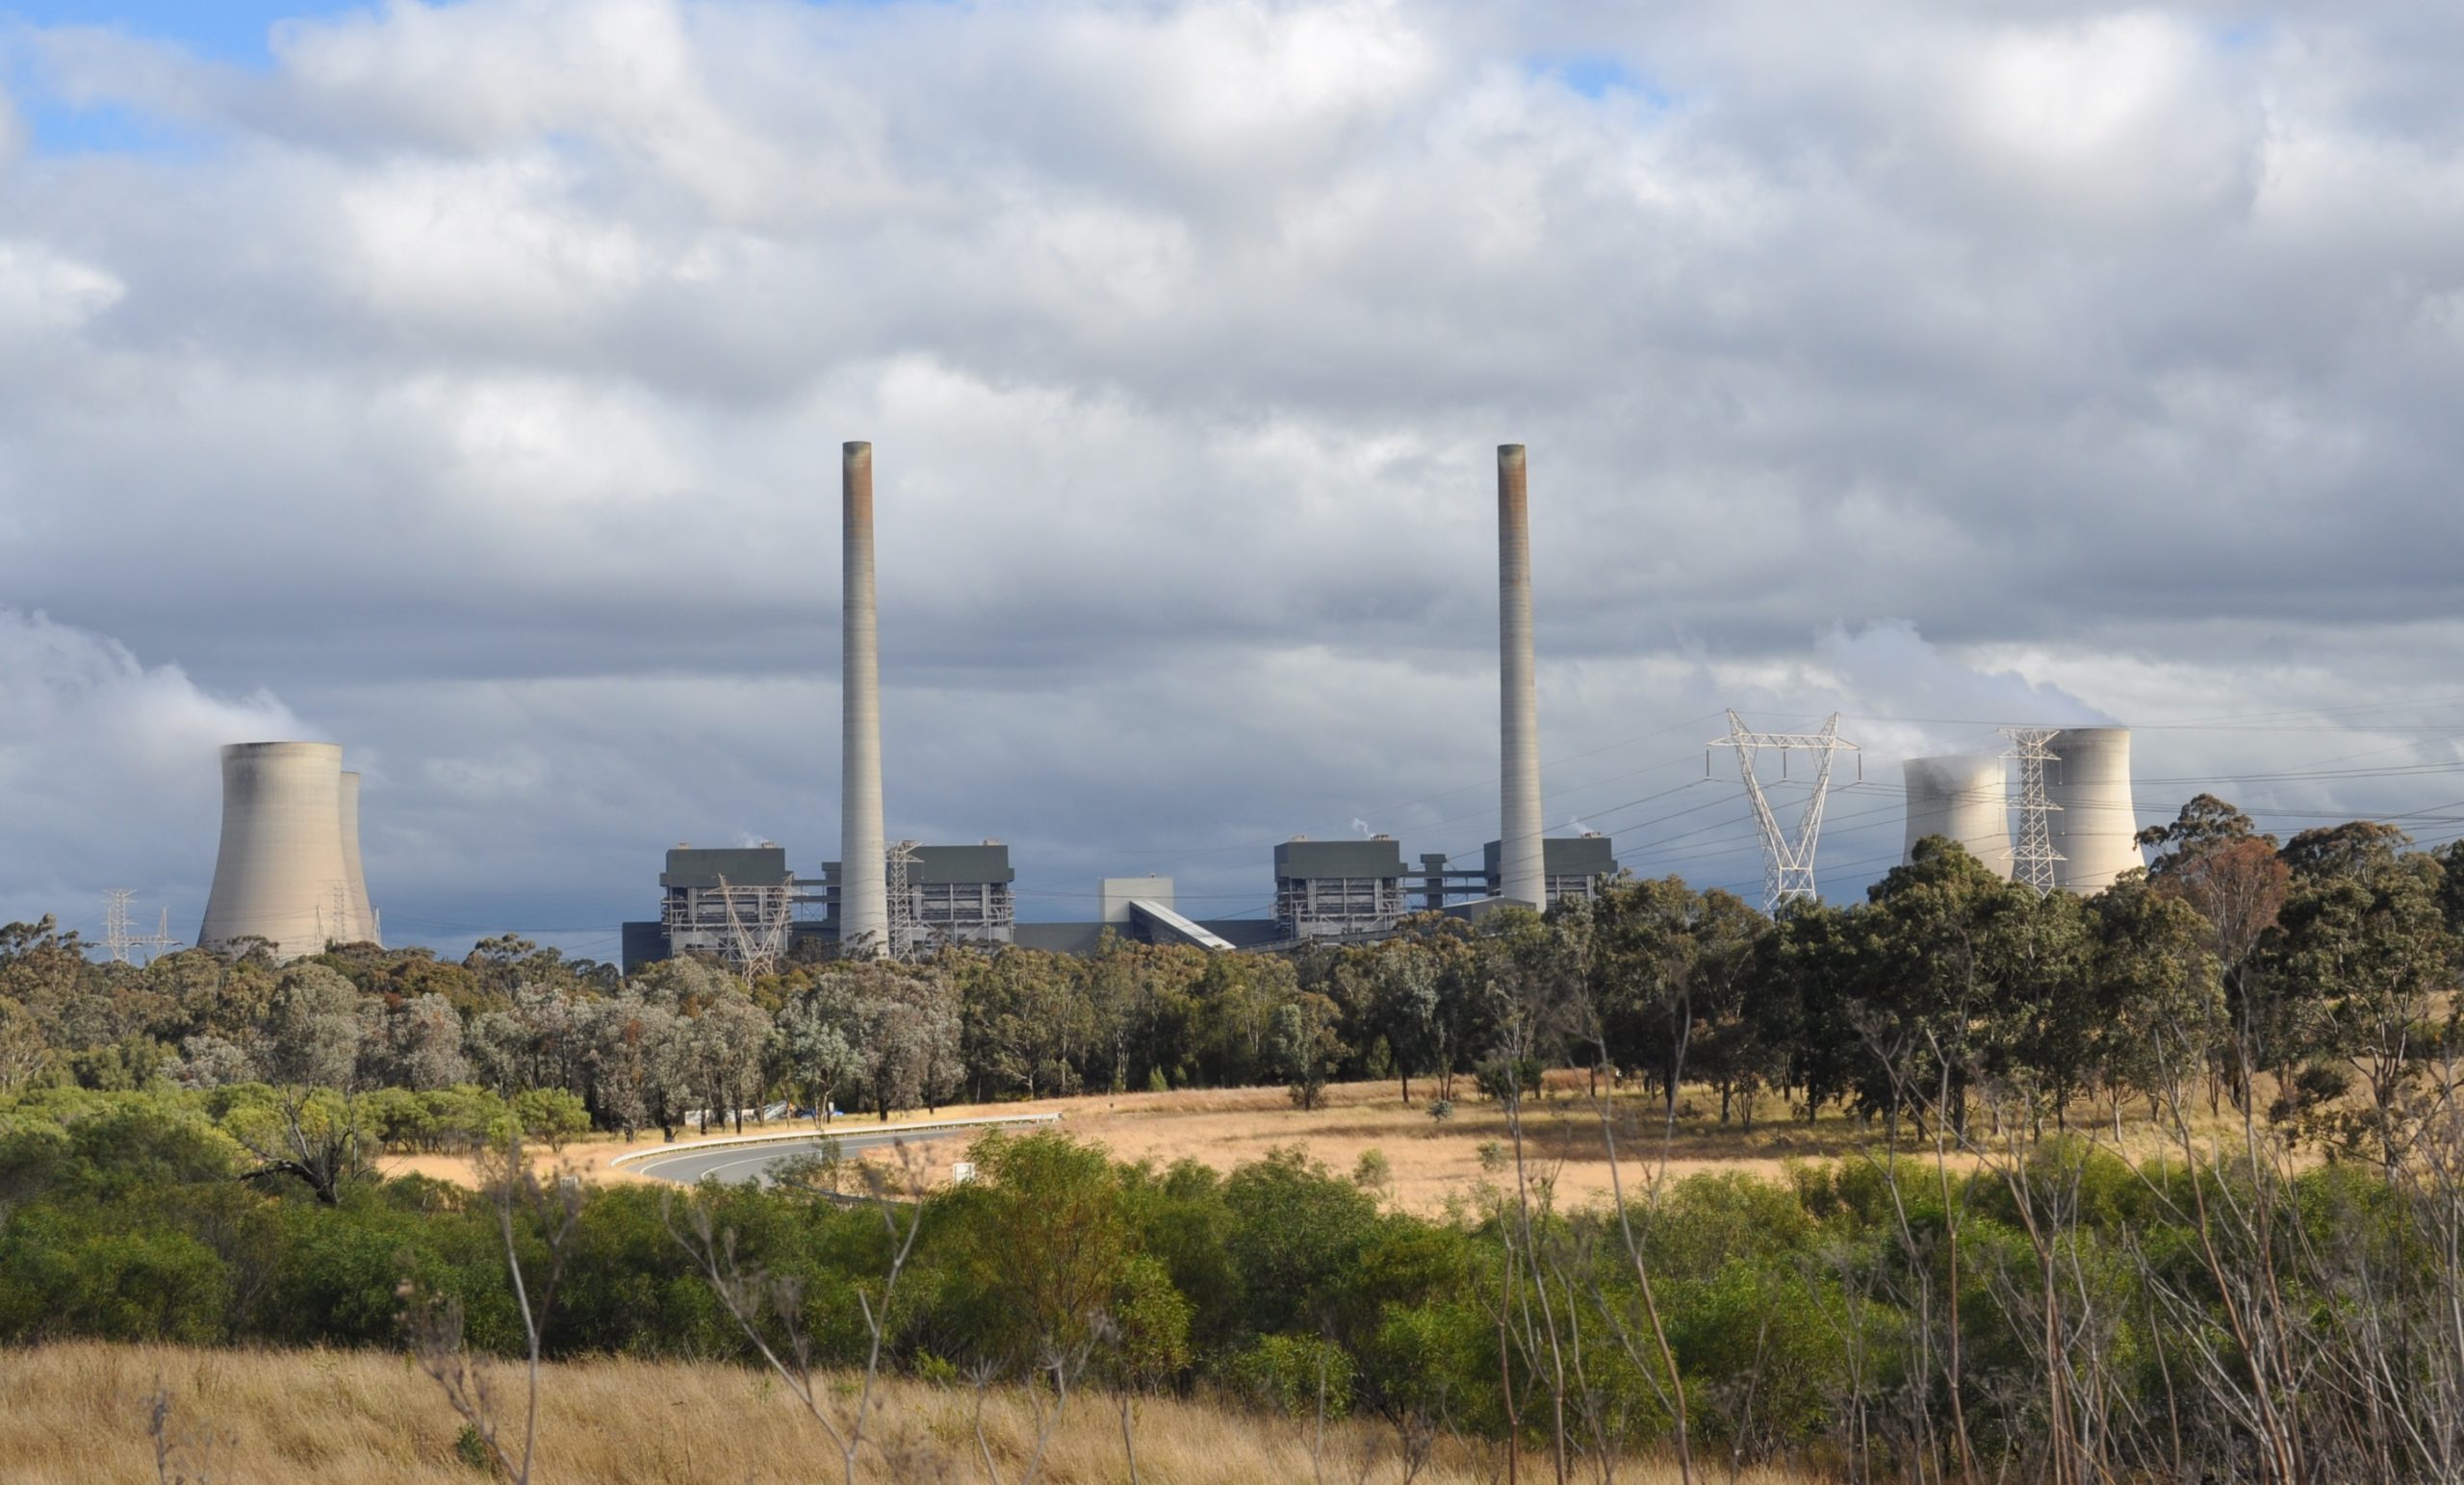
Figure 8 Bayswater Power Station July 2025 – note 4 cooling towers
Liddell power station relied on Lake Liddell as a cooling water pond, with water supplied from the Hunter River system. Bayswater Power station uses evaporative cooling tower structures and is supplied via a pipeline from the Hunter River feeding buffer storages including Lake Liddell.
In 2014, AGL assessed the acquisition of Macquarie Generation, the previous owner of both Liddell and Bayswater power stations. AGL identified annual water consumption of 61 GL against 106 GL of water entitlements, with large “onsite” water storage volume (including Lake Liddell 148 GL and Plashette Reservoir 65 GL both owned by AGL Macquarie.
This is the equivalent of three years’ water use, further buffering water supply risk. The study also noted that generation was unimpeded by water supply from 2000 to 2007 during the Millennium Drought.
In addition to water entitlements under the Water Sharing Plans for the Hunter Regulated River and
Hunter Unregulated and Alluvial Water Sources, AGL Macquarie acquired the Barnard River Scheme, a system constructed during drought conditions in the mid-1980s to transfer up to 20 GL per annum of water from the Barnard River, a tributary of the Manning River, to Oaky Creek, a tributary of the upper Hunter. This scheme was designed to boost water availability for Bayswater Power Station in drought conditions, and has been used only once since construction.[1]
Cooling Options for Nuclear Power Plants
In the following Table 3 two options for cooling nuclear plants are compared with water use through Bayswater/ Liddell coal plants.
Option 1 envisages the two plants being located on the Bayswater site and using the existing cooling towers, switchyard, pipeline connection and link to Lake Liddell. Annual electrical energy output is 18.5TWh/yr with Annual water demand is 51.9GL/yr at 92% capacity factor.
Option 2 would construct the two plants at the Liddell site and use pond cooling for one plant with cooling towers for the second plant. This option has an output of 18.5TWh/yr but has a reduced water demand of 44.5GL/yr
Under these options the nuclear plants produce 18.5TWh/yr compared to the two coal plants output of 26.7TWh/yr. By comparison, the water demand of the two coal plants is 61 GL/yr. Refer to Table 4.
Option 3. With the 2.3GW of nuclear using significantly less than both the operational history and license capacity of the coal plants, the option may exist to increase the size of the nuclear plants to three APR1000 units with 3.45GW of capacity. This results in an output of 27.8TWh/yr with a water demand of 70.4GL.
Option 4 would construct two larger APR1400 plants at the Liddell site and use pond cooling for one plant with cooling towers for the second plant. This option has a reduced water demand of 65GL/yr but puts out 22.5TWh/yr of electrical energy.
By comparison, the water demand of the two coal plants is 61 GL/yr at an electrical energy output of 26.7TWh/yr. Refer to Table 4.
Figure 9 – Ranges of Rates of operational water consumption by thermal and non-thermal electricity generating technologies. [2]
Table 4 Water Demand – Coal vs Nuclear at Bayswater/Liddell site
| Water Demand | Plants | Plant capacity | Capacity Factor | hrs/yr | Annual Generation | Water | ||||||||||||||||||||||||||||||||||||||
| m3/MWh | MW | MWh/yr | M3 | GL | ||||||||||||||||||||||||||||||||||||||||
| Option 1 | Two NPP’s use cooling towers | |||||||||||||||||||||||||||||||||||||||||||
| Cooling Towers | 2.8 | 2 | 1150 | 0.92 | 8760 | 18,536,160 | 51,901,248 | 51.9 | ||||||||||||||||||||||||||||||||||||
| Option 2 | One NPP on cooling towers and one uses the cooling pond | |||||||||||||||||||||||||||||||||||||||||||
| Cooling Towers | 2.8 | 1 | 1150 | 0.92 | 8760 | 9,268,080 | 25,950,624 | 25.9 | ||||||||||||||||||||||||||||||||||||
| Pond Cooling | 2 | 1 | 1150 | 0.92 | 8760 | 9,268,080 | 18,536,160 | 18.5 | ||||||||||||||||||||||||||||||||||||
| Total | 18,536,160 | Total | 44.5 | |||||||||||||||||||||||||||||||||||||||||
| Option 3 | Two NPP’s use cooling towers and one uses the cooling pond | |||||||||||||||||||||||||||||||||||||||||||
| Cooling Towers | 2.8 | 2 | 2,300 | 0.92 | 8760 | 18,536,160 | 51,901,248 | 51.9 | ||||||||||||||||||||||||||||||||||||
| Pond Cooling | 2 | 1 | 1150 | 0.92 | 8760 | 9,268,080 | 18,536,160 | 18.5 | ||||||||||||||||||||||||||||||||||||
| Total | 27,804,240 | Total | 70.4 | |||||||||||||||||||||||||||||||||||||||||
|
||||||||||||||||||||||||||||||||||||||||||||
| Coal Plants | ||||||||||||||||||||||||||||||||||||||||||||
| Bayswater | 2640 | 0.7 | 8760 | 16,188,480 | ||||||||||||||||||||||||||||||||||||||||
| Liddell | 2000 | 0.6 | 8760 | 10,512,000 | ||||||||||||||||||||||||||||||||||||||||
| 2.28 | Total | 26,700,480 | 61,000,000 | 61 | ||||||||||||||||||||||||||||||||||||||||
[1] Reference to Report of April 2025 by Alex Campbell of Triple Helix Consulting for Liberals Against Nuclear
[2] Renewable Energy in the Context of Sustainable Development, Chapter 9 IPCC, Figure 09.14
An excellent and detailed outline of the cooling options is available at: Cooling Power Plants | Power Plant Water Use for Cooling – World Nuclear Association