
17 Oct Nuclear Energy is Essential to Emissions Reductions
Outline
In this paper we compare the effectiveness of electricity generating systems based exclusively on wind, solar and hydro – referred to as “Renewable” with those based predominantly on nuclear energy. We compare their results in terms of emissions intensity and cost with the National Electricity Objectives as stated in the National Electricity Law (NEL). We find that only nuclear energy based systems can meet the requirements of the NEL in term of cost and reaching Net Zero emissions goals.
1. Introduction
All states and territories are committed to “Net Zero by 2050” economy wide This applies to transport, electricity generation, agriculture, waste handling, heavy and light industry and industrial processes.
It’s easier to decarbonise the electricity sector than other sectors because:
- the sources of generation are stationary and
- we have the established transmission and distribution system in place that can feed ultra-low carbon energy to consumers and
- Successful International precedent exists
2. Ultra Low Carbon Generators
Electricity production must facilitate carbon reductions in other sectors such as:
- Transport sector via battery charging or the production of zero carbon liquid fuels,
- Industrial sector using hydrogen in processes such as steel making,
- Industrial processes through the replacement of fossil fuels with electricity.
For example, given the difficulties in decarbonising the agricultural sector and many industrial processes, electricity production must be ultra-low carbon to minimise overhang from the other sectors.
That means that the electricity system must have an emissions intensity of 50 g-CO2/kWh or less measured on a Life Cycle Analysis basis (LCA). LCA takes account of embodied emissions incurred through the mining, manufacturing processes and plant construction.
3. Achieving Ultra Low Emissions and Cost
In brief we compared six scenarios to determine the lowest cost ultra-low emissions scenario. The scenarios were:
- A control which used an energy mix similar to that of the NEM in 2022,
- A 100% renewable system which contains no fossil fuel backup,
- The AEMO Step Change Scenario in 2050,
- The AEMO Progressive Change Scenario in 2050,
- Nuclear Integrated System Plan – 50% Nuclear,
- Nuclear Integrated System Plan – 74% Nuclear,
Our analysis reveals that in the case of scenarios 2, 3 and 4 which rely almost exclusively on wind and solar energy very high levels of spillage and/or curtailment occur. In effect not all energy can be used leading to high costs due to low capacity factors, equipment redundancy and low utilisation of transmission
The tool we used to carry out these comparisons was the Electric Power Consulting ty Ltd “Power System Generation Mix Model”. An example of the application of the model is contained in the EPC modelling of the AEMO Draft 2024 ISP that was released in December 2023. This can be viewed at this link:
https://www.epc.com.au/wp-content/uploads/EPC-Submission-on-the-2024-Draft-ISP-20240216-Final.pdf
For this report the costs of generators were obtained from the CSIRO GenCost report except for nuclear energy which used:
- A$10,000/kW overnight capital cost. Increased from GenCost value of $8,655/kW
- A$8.16/MWh fuel allowance in line with Nuclear Energy Institute values
- A$31 allowed for operations and maintenance in line with Nuclear Energy Institute values
Emissions factors used for generators in the model are shown in “Table 1 Emissions Factors and Parameters used in Scenario Modelling”.
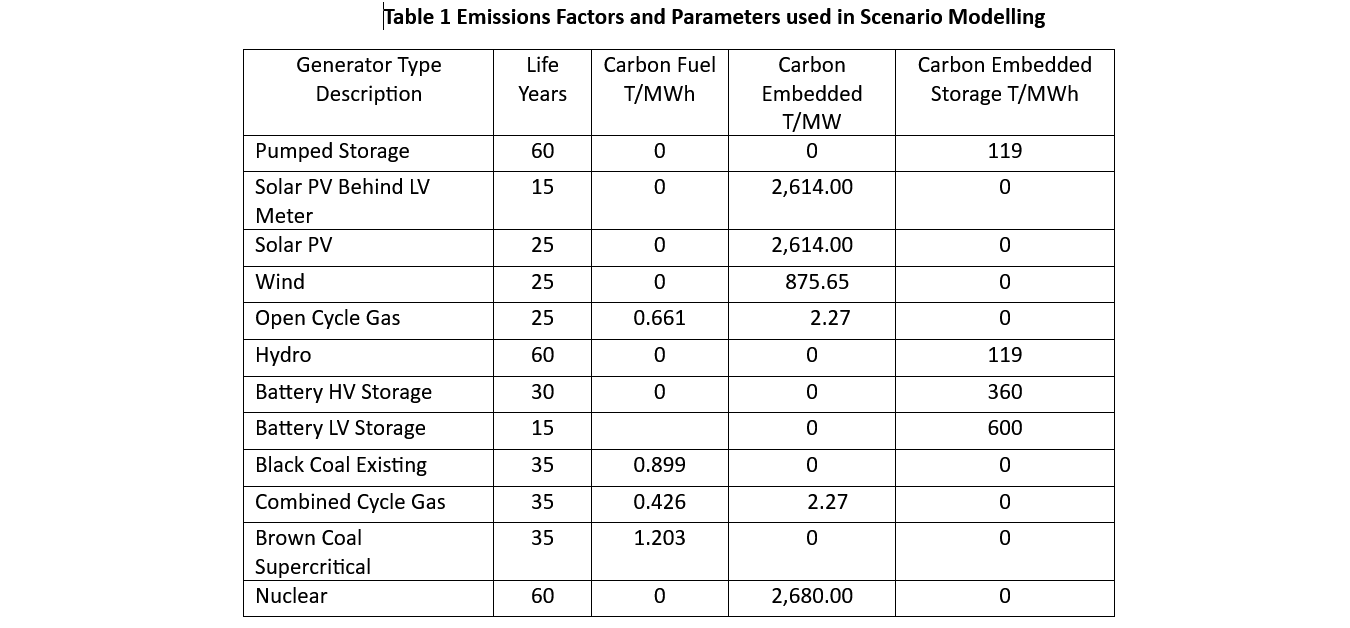
The emissions factors used are measured in T/MW and T/MWh and some explanation is needed to for these units:
- For constructed plant or equipment the embodied carbon dioxide is reported as of tonnes per megawatt (T/MW). This fixed amount is disbursed over every unit of energy (MWh) that the plant and equipment produce over their service life.
- For fuel burned in a fossil fuelled plant the emissions are reported as tonnes of carbon dioxide produced from burning to produce a MWh of electrical energy, namely T/MWh.
- For constructed storages such as batteries or pumped hydro we also use tonnes of carbon dioxide per MWh (T/MWh) but in this case the unit relates to the construction and size of the storage which is measured in MWh. So for example, how many tonnes of carbon dioxide were produced to build the capacity of a battery or pumped storage facility to store a MWh of energy.
The value of 2,614 T/MW for solar PV has a significant impact on the overall emissions intensities calculated for each scenario, especially for high levels of “Renewables”. It was obtained from recent analysis done by Seaver Wang of the Breakthrough Institute at this link:
http://Solar PV GHG calculation, head-to-head – Google Docs
The value of 2,614 T/MW was used to reflect the near total dominance of Chinese manufactured solar panels in the Australian market. Throughout the Chinese manufacturing process very high levels of electricity is generated using coal power.
The comparative cost and emissions performance of each scenario was modeled and is summarised in Figure 1 – Nuclear and Renewable Energy Scenarios.
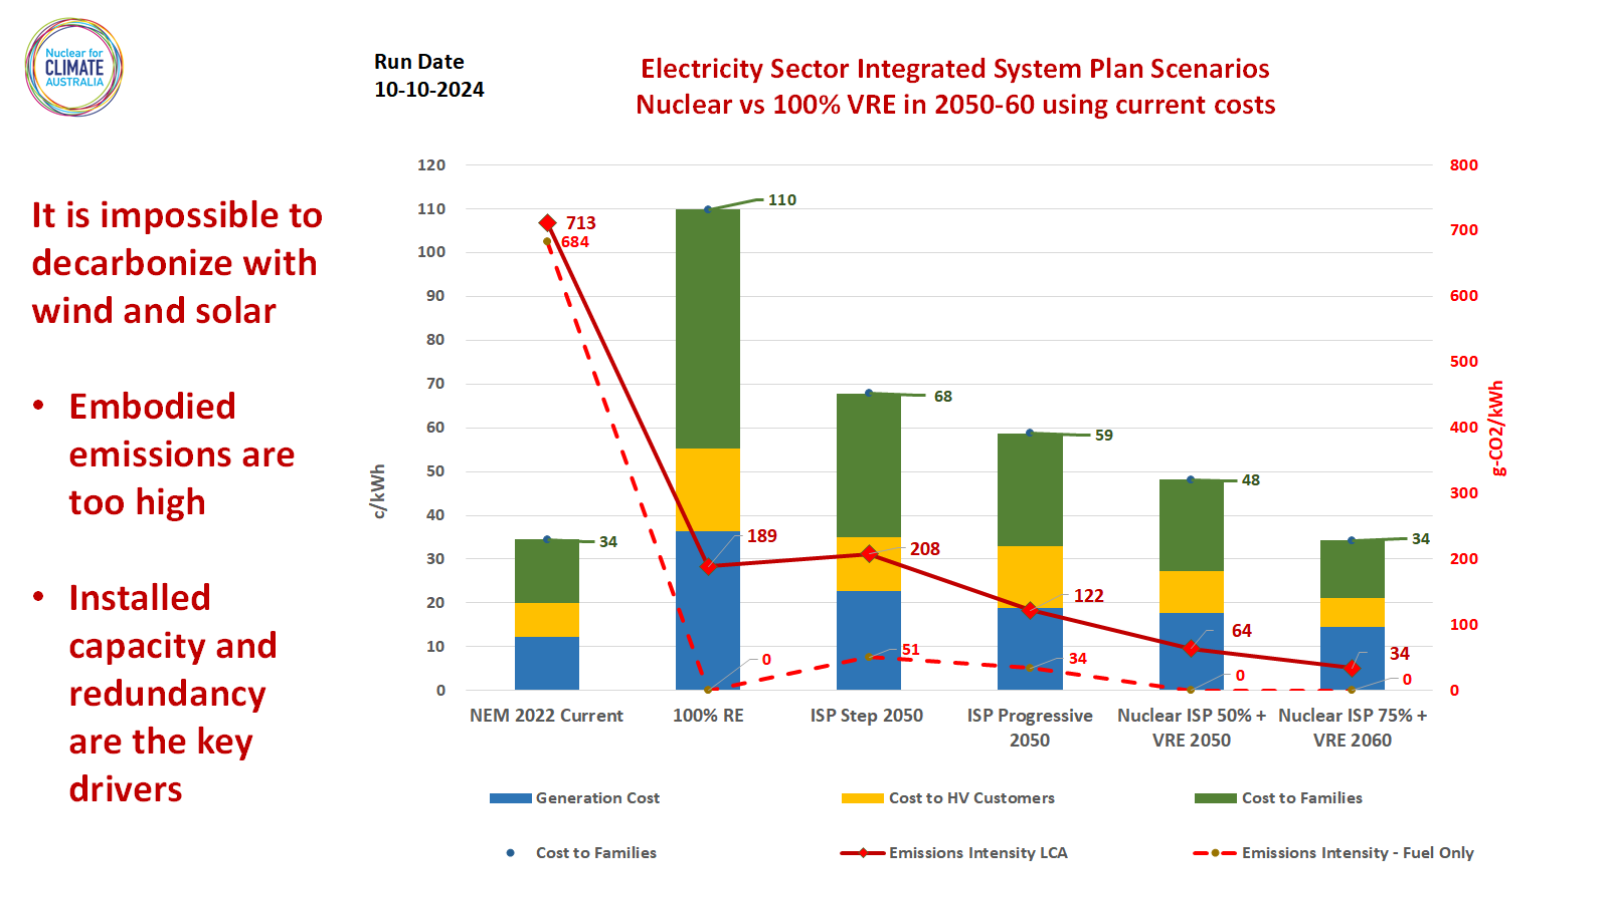 Figure 1 – Nuclear and Renewable Energy Scenarios
3.1 Explanation of Graph shown in Figure 1:
- The left-hand axis shows electricity costs in c/kWh while the right-hand axis shows system emissions intensity in g-CO2/kWh on a Life Cycle Analysis basis.
- On each column blue represents cost of system generation, yellow represents extra cost for high voltage users getting energy from high and medium voltage transmission such as large industry and urban electric train systems.
- Green represents the extra cost to distribute energy from the High Voltage transmission system through to low voltage users such as general industry, small business and residential users.
- The dashed red line and data points are the emissions intensity derived from fuel burning for each scenario.
- The continuous red line and data points are the total system emissions intensity using Life Cycle Analysis (LCA)for each scenario.
Of the low carbon options the two nuclear scenarios have the lowest system costs and only the 75% nuclear is ultra-low carbon. The 100% Renewable and the Step Change fail to achieve either low or ultra-low emissions.
The reasons are shown in the following three images.
3.2 Step Change Scenario fails to achieve low emissions or low costs
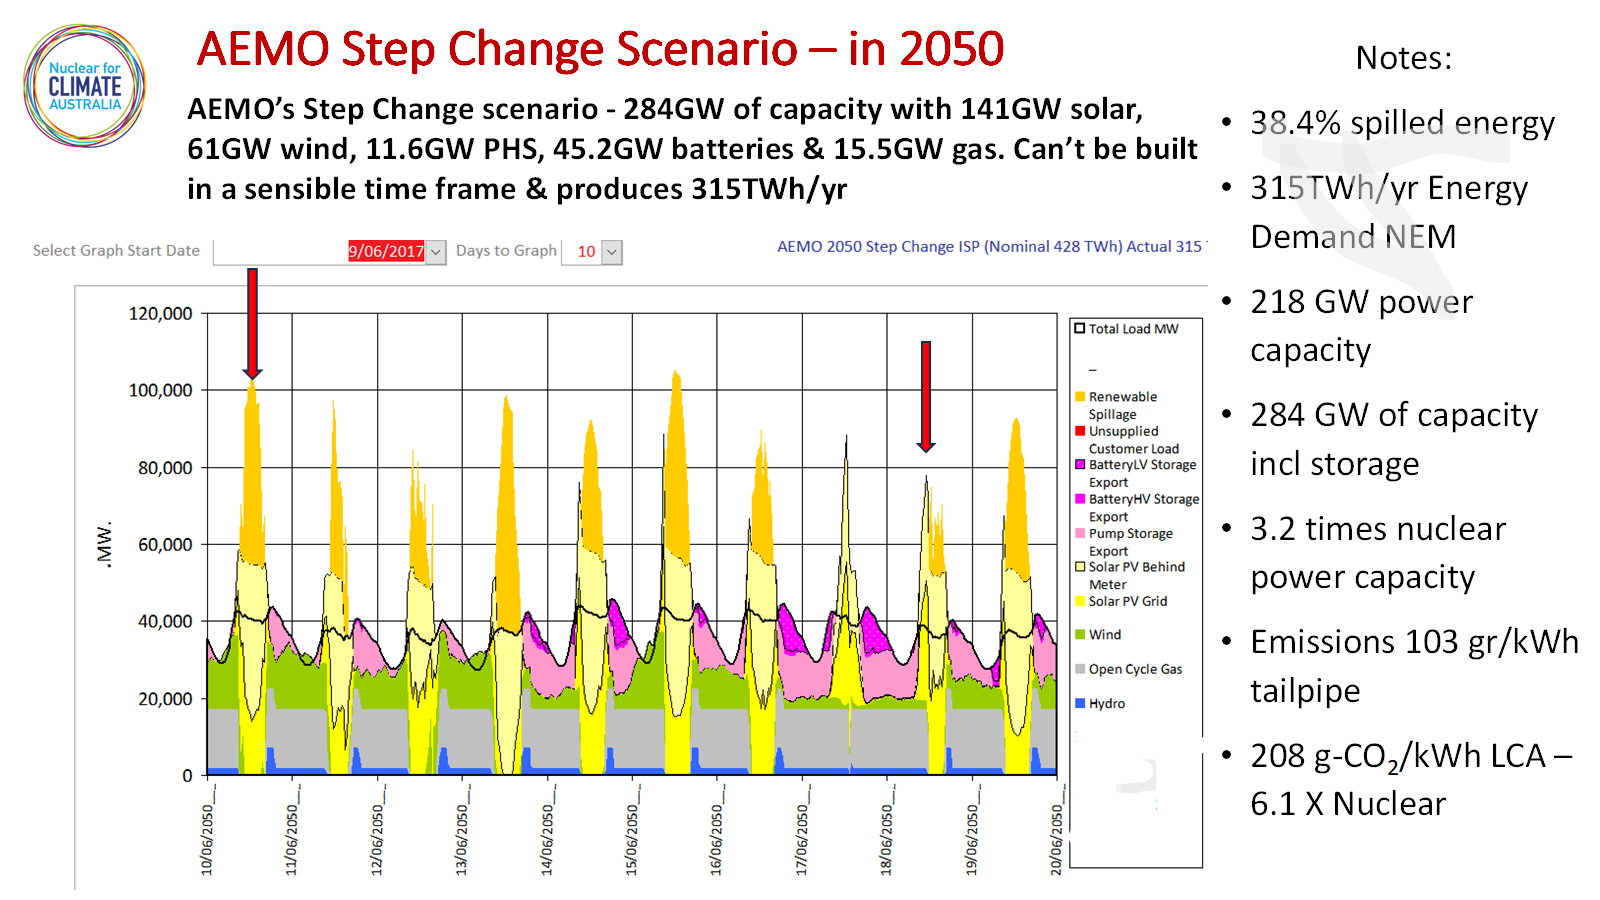 Figure 2 – Step Change Energy Graphic
Figure 2 – Step Change Energy Graphic shows a ten day period in a June month. The thick black wavey line represents the NEM load, dark blue represents hydro, grey is gas, green is wind, pink tones represent battery and pumped storage and the two yellow tones represent roof top and grid solar PV. Orange above PV represents spillage/curtailment.
Under the red arrow on the right-hand side we have a day when the system meets load with no spillage because wind output is very low. Under the left-hand red arrow wind has returned, storage is minimised and spillage is very large. This demonstrates some of the fundamental reasons why wind and solar based systems fail both emissions and cost minimisation.
These are:
- Large amounts of redundant generation and storage are required to cope with fluctuating wind and solar output. In effect we have a very large “overbuild”.
- Collapse of capacity factors caused by redundancy drives up embodied emissions especially from installed solar PV and gas backup to around 208 g-CO2/kWh. This is a very mediocre emissions reduction and can’t be described as “low carbon”.
- Expansion of the High and Medium Voltage transmission grid has inefficient levels of utilisation due to fluctuating outputs from Renewable Energy Zones. This drives up network costs.
- Very high levels of installed battery and pumped storage have low capacity factors and very high costs and embodied emissions.
- Spillage/curtailment of 38% of generation occurs with the Step Change scenario.
3.3 100% Wind, Solar and Hydro Scenario fails to achieve low emissions or low costs
A 10 day winter period with 100% wind, solar and hydro is shown in Figure 3 – 100% “Renewable Energy” Graphic. Here we have a scenario where gas backup is removed from the system which is now totally reliant on wind, solar and hydro.
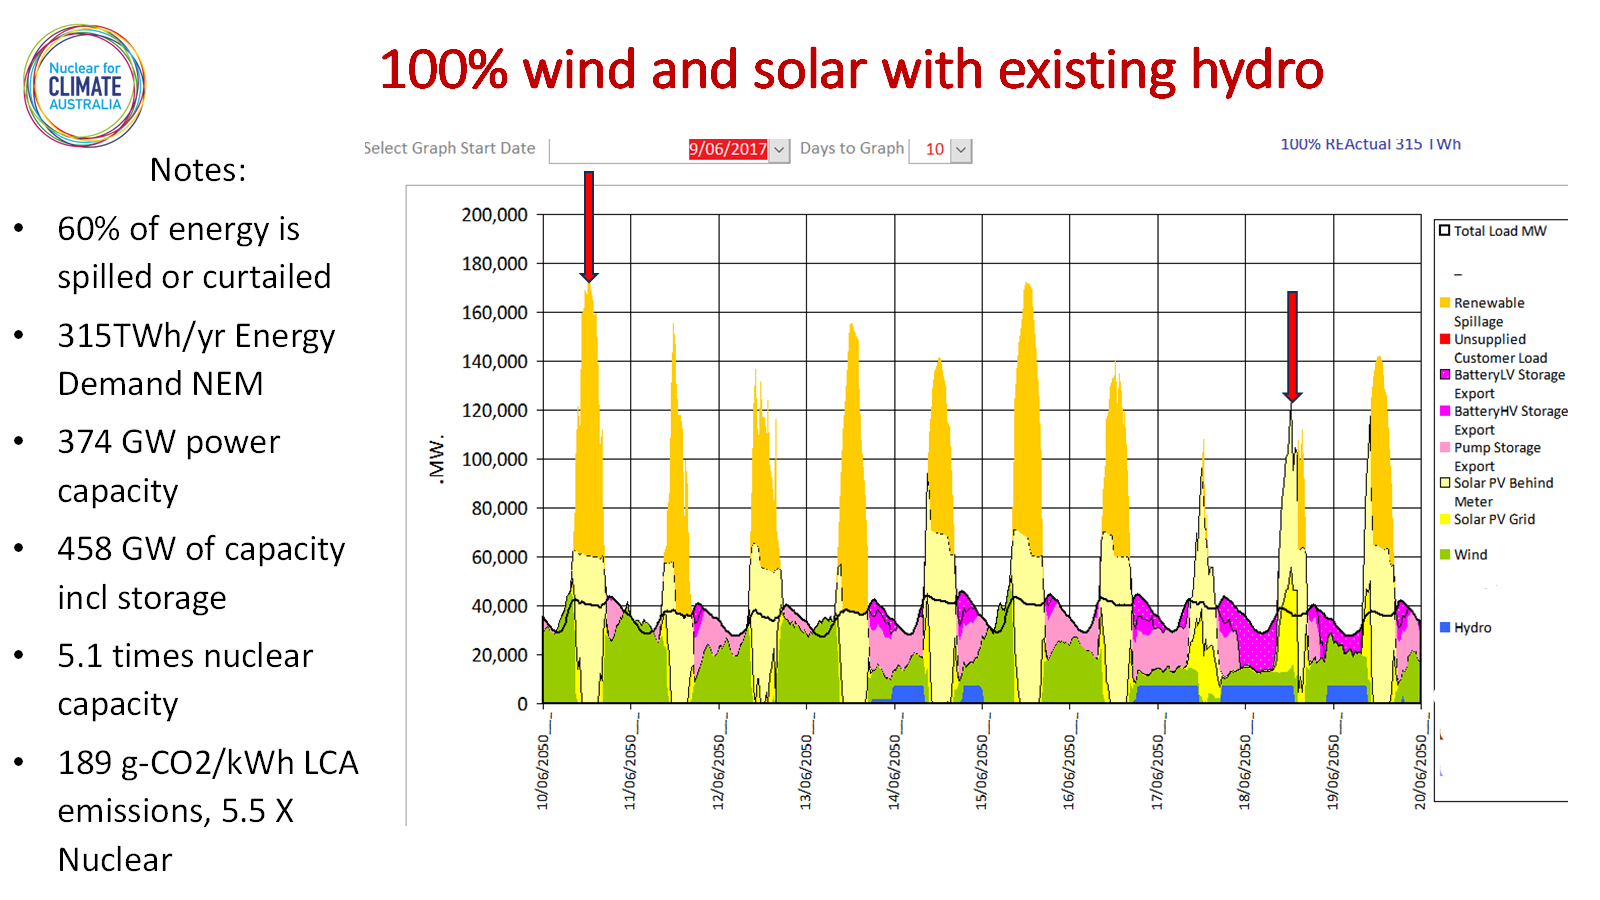 Figure 3 – 100% “Renewable Energy” Graphic
Costs rise massively due to very large increases in redundancy, storage, distribution and transmission. We now have 5.1 times more power capacity connected to the grid compared to an equivalent nuclear scenario and 60% of energy is curtailed or spilled. With these huge amounts of connected generation and storage the emissions intensity remains stubbornly high at 189 g-CO2/kWh on an LCA basis. despite the removal of fossil fuel-powered generation from the system.
3.4 75% nuclear scenario with wind, solar and hydro achieve ultra-low emissions at economic costs
Reference is made to Figure 4 – 75% nuclear energy with wind, solar and hydro.
This scenario contains 33.5 GW of installed nuclear capacity operating at 81% capacity factor. Assumed NEM demand is 315 TWh per year compared to the current value of approximately 200TWh/year.
![]() Figure 4 – 75% nuclear energy with wind, solar and hydro
Figure 4 – 75% nuclear energy with wind, solar and hydro
The costs of nuclear power plants used in this analysis are:
- A$10,000/kW overnight capital cost.
- A$8.16/MWh fuel allowance
- A$31 allowed for operations and maintenance
- 6% Annual Discount Rate,
- For this example the calculated LCOE is A$140/MWh at 81% capacity factor
Emissions on an LCA basis have dropped to 34 g-CO2/kWh. The retail cost to consumers is 34 c/kWh is ½ that of the Step Change Scenario and 1/3rd that of the 100% wind, solar and hydro option.
4. A Nuclear Plan for the NEM
A proposed timeline for the roll out of a comprehensive nuclear energy plan is shown in Figure 5 – A Nuclear Plan for the NEM
Relevant parameters are:
- Roll out is completed in 2060 with 36.8 GW of installed nuclear capacity.
- Plants operate at 84% capacity factor.
- Installed wind is 11.5GW, Grid solar – 23 GW and roof top solar is 25GW.
- Total NEM load in 2060 is 364 TWh/yr.
- Emissions intensity in 2060 will be 36 g CO2/kWh and cost to consumers is 35.5 c/kWh
- Emissions in 2050 are 51 gr CO2/kWh or about 1/3rd that of the Step Change Scenario in the same year.
- Coal plants continue through to 2050 though at a significantly diminishing rate.
- Gas consumption is minimised to prevent the construction of stranded assets and minimise electricity costs.
![]() Figure 5 – A Nuclear Plan for the NEM
Figure 5 – A Nuclear Plan for the NEM
Claims that nuclear “takes too long” and “we have no time to wait” are addressed in Figure 6 Cumulative Emissions – Step Change vs Nuclear
Here we show that a nuclear baseload system will have lower accumulated emissions after the 2070’s and then cumulative emissions from nuclear energy will always be lower than a 100% wind and solar based system. Given the high levels of embodied emissions the hopes for a fast transition to low carbon energy using wind and solar will not materialise
A real world example of this happens everyday with the comparison of French electricity emissions with its neighbour in Germany shown in Figure 7 German vs French Electricity sector Emissions.
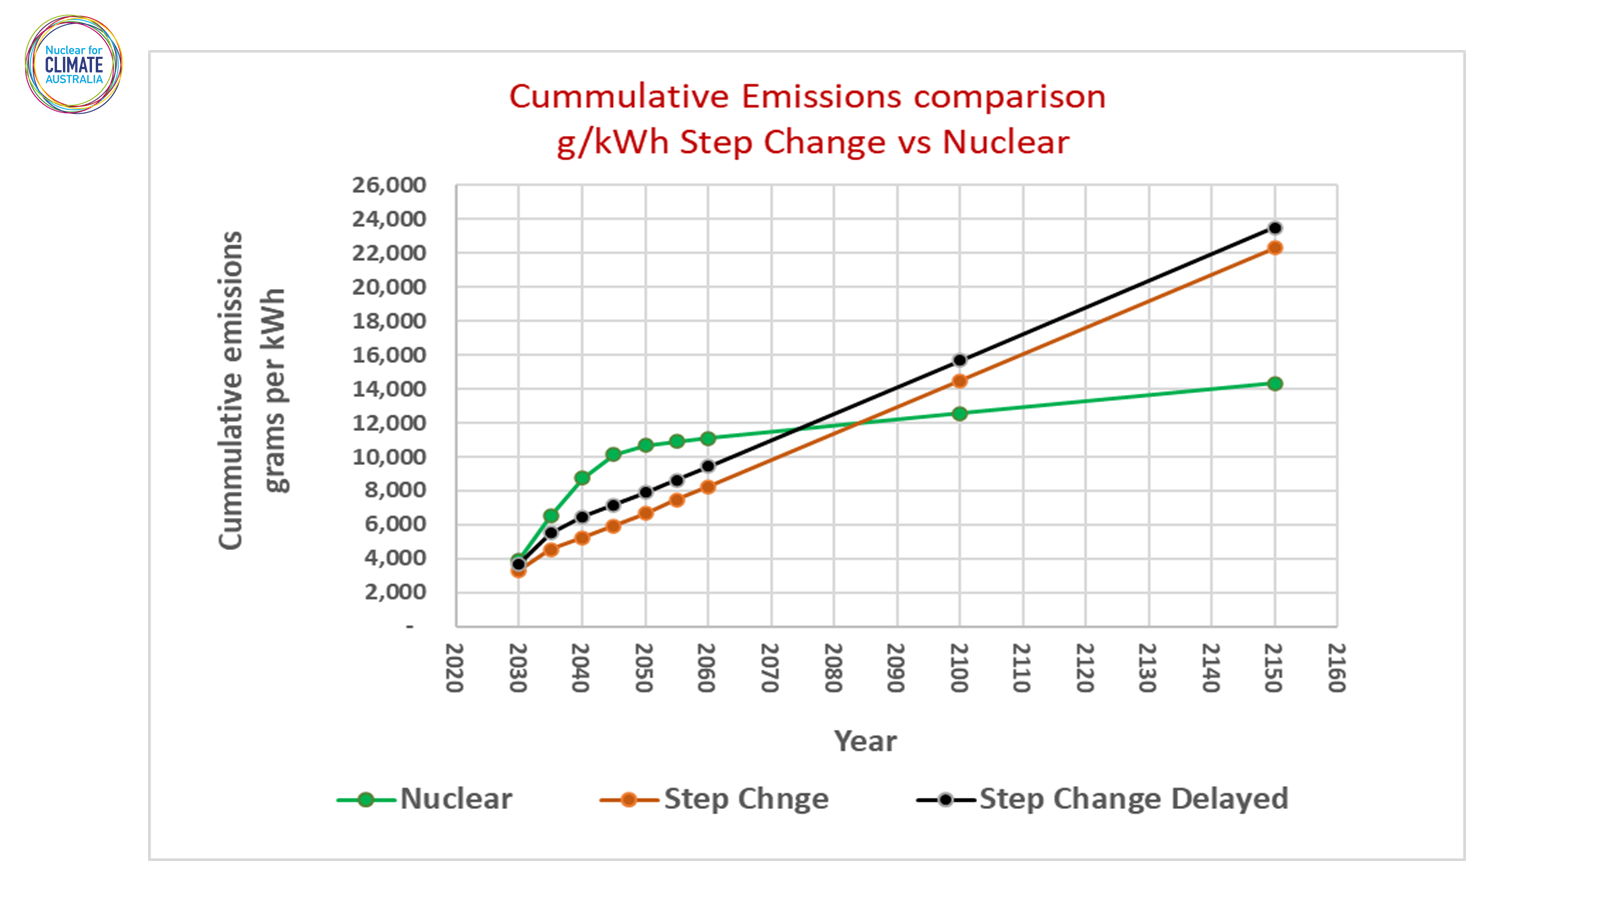 Figure 6 Cumulative Emissions – Step Change vs Nuclear
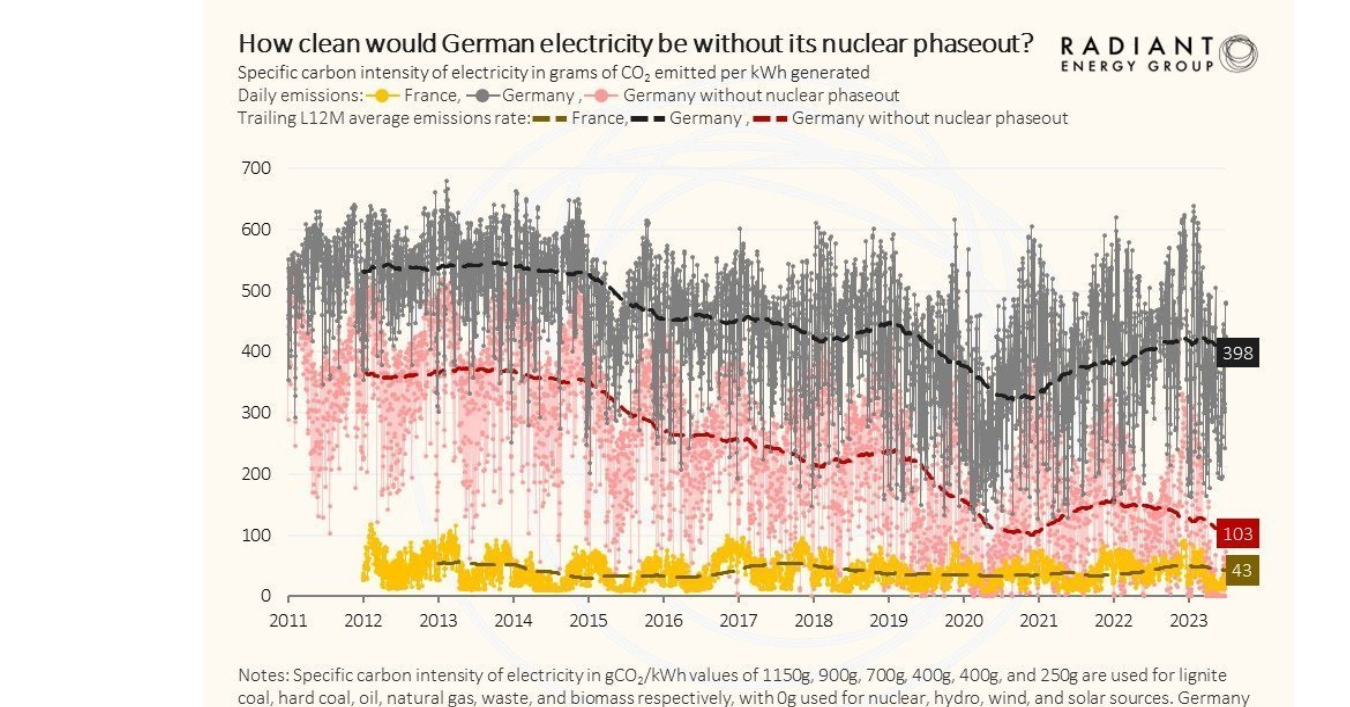 Figure 7 – German vs French Electricity sector Emissions
Image uses data from Fraunhofer ISE, RTI-France, ENSTO-E and Radiant Energy Group
5. Materials Consumption is minimised with nuclear energy.
The energy transition was intended to herald a more sustainable future however attempting to achieve this with wind and solar will only result in a massive increase in materials consumption. These materials will litter the landscape and their end of life retrieval is neither certain nor affordable.
We have compared the materials use of two scenarios over an 80 year life in Table 2 – Materials used in Nuclear Energy system vs 100% wind and solar. That period was chosen because it can be expected that modern nuclear power plants such as the AP1000 will last for 80 years while wind generators will last for 30 years and solar PV for 25 years.
To arrive at these values in Table 2 we used recent data from the “Updated Mining Footprints and Raw Material Needs for Clean Energy – Challenges and opportunities for managing energy transition mining impacts” by Wang, Cook, Stein, Lloyd and Smith of the Breakthrough Institute. Its available at this link:
We then applied the materials used in wind, solar, nuclear and batteries to the amount of generating and storage capacity used in a 100% “Renewables” scheme on the NEM to a comparable Nuclear Energy scheme. We used the amount of equipment required in the comparison from values obtained in scenarios modelled by Nuclear For Climate Australia and Electric Power Consulting
Advocates for wind and solar frequently claim that components from these “Renewable” schemes are recyclable. This potential is limited by the energy and cost inputs required to recycle these components especially where:
- they are located far from their place of manufacture and;
- the costs of recovery are incurred in economies that have higher labour and equipment inputs than the place of extraction, refining and manufacture.
Nevertheless the degree to which recycling can occur was handled by looking at both the initial materials load for each system with the subsequent rebuild. Even if 100% of the Wind and Solar system could be recycled its initial materials load of 191 Million tonnes of gear would require 3.9 times that of the nuclear system with 72 million tonnes.
At the end of the day, materials consumption in manufactured items is a good proxy for comparative costs. This reinforces our finding that a nuclear energy based system is ½ to 1/3rd the cost of a “Renewables” system. Given the large amounts of materials used with wind and solar it begs the question – What Does Renewable Mean?
![]()
In Figure 8 shown next, the brown columns show the initial materials load of a 100% RE system and orange above brown shows the contested amount that possibly could be recycled to some degree. Likewise the dark and light green show the ranges for the nuclear system.
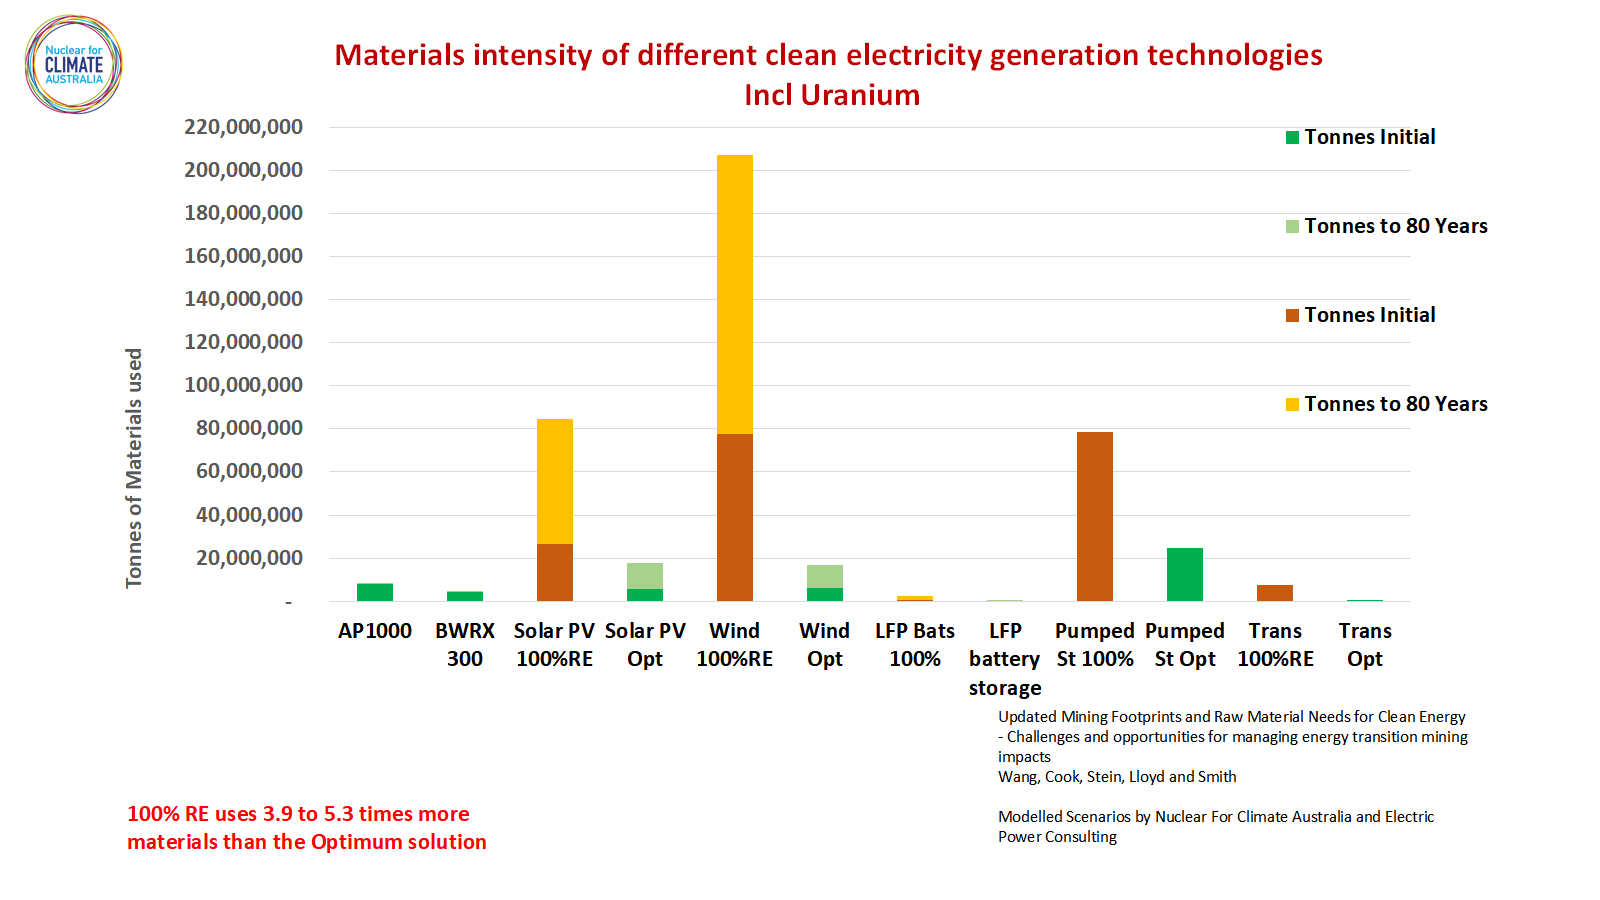
Figure 8 Comparison of materials used in 100% wind and solar scheme with a nuclear dominated scheme
6. Conclusion
There will be no net zero or any other zero emissions outcome unless a system based on high levels of nuclear energy is deployed.
Systems based exclusively on wind, solar and hydro cannot achieve deep decarbonisation in order to conform with jurisdictions aiming for “Net Zero”. This failure is due to high levels of embodied carbon and the collapse in capacity factors when wind and solar have high penetration rates on the grid.
These conclusions are supported by the very large amounts of material required to deploy wind and solar which are four to five times greater than required by a nuclear based system.
No Comments