Queensland locations for nuclear energy
- Existing System
- Queensland Generating Capacity and Output 2024
- Nuclear Energy in Queensland
- Cooling Queensland Nuclear Plants
- Costs of Queensland Nuclear Plants with Transmission Upgrades
- Details and Images of Selected Sites
Edition 6, Revised 10/04/2026
Existing System
Queensland has a very long high voltage transmission grid that extends 1,700km from north of Cairns to the New South Wales border. Apart from the populated south east corner and the industrialised Gladstone region this long grid feeds a state with a low population density.
The Queensland’s electricity transmission network currently comprises 275kV transmission lines from Cairns to the southern Gold Coast, with 110kV and 132kV transmission lines providing transmission in local areas and supporting the 275kV network.
In addition, 330kV transmission lines link Queensland to the New South Wales network, allowing the flow of high voltage electricity between the two States.
A 500kV transmission network is being introduced in South East Queensland. Note that one 500kV power line is capable of carrying about the same amount of electricity as three 275kV transmission lines, with a much smaller land use requirement.
Queensland Generating Capacity and Output in 2024
Queensland is Australia’s most energy hungry state on a per capita basis. Currently 72.2% of electricity generated in that state comes from fossil fuels. Even with proposed renewable energy projects the actual CO2 emissions intensity will only reduce marginally because of the poor capacity factors of wind and solar generation and the backup required from gas plants in particular.
The generating units at coal fired plants such as Stanwell, Gladstone, Tarong and Callide are not especially large being in the range of 350MW to 450MW and are matched to a 275kV transmission system.
The performance of the Queensland generating system as a whole is shown in the following Table 1 for 2024.
| Generator | Capacity (MW) | Proportion | Output (GWh) | Proportion | Capacity Factor |
| Coal | 8,130 | 64.1% | 42,867 | 65.0% | 0.61 |
| CCGT | 1,418 | 5.0% | 3,316 | 5.0% | 0.27 |
| OCGT | 1,603 | 1.4% | 919 | 1.4% | 0.07 |
| Gas CM | 2,256 | 0.7% | 438 | 0.7% | 0.02 |
| Wind | 1,018 | 4.5% | 2,933 | 4.4% | 0.33 |
| Solar Utility | 4,640 | 9.1% | 6,069 | 9.2% | 0.15 |
| Solar R/T | 6,082 | 12.7% | 8,523 | 12.9% | 0.16 |
| Hydro | 164 | 2.2% | 457 | 0.7% | 0.32 |
| Recip Eng | 189 | 0.1% | 40 | 0.1% | 0.02 |
| Hydro PS | 540 | 0.0% | |||
| Biomass | 30 | 0.3% | 217 | 0.3% | 0.83 |
| Battery | 507 | 0.2% | 144 | 0.2% | 0.03 |
| 26,577 | 100.3% | 65,923 |
Total electricity generating capacity (not including storage) in Queensland in 2024 was 25,530MW which generated 65TWh of gross electricity production[ii].
Nuclear Energy in Queensland
Queensland would host about 31% of the nuclear plant capacity outlined in our “Planned Nuclear capacity on the NEM” :
- 6 GW in 2050 coming from four large 1.4GW nuclear power plants and
- 8.4 GW by 2060 coming from six large 1.4 plants
Smaller 1.05GW plants could also be used. Based on our discussions with South Korean nuclear power plant constructors, plants need to be built in multiples at each site to achieve their greatest economies. Cooling capacity will therefore be required to suit at least 2.8GW for large plants at these locations.
Cooling Queensland Nuclear Plants
In Queensland coal fired plants were constructed adjacent to available coal mines and other infrastructure.With the exception of the Stanwell site, the cooling resources at the old coal plant sis unlikely to be large enough to meet the needs of multiples of large nuclear power plants at each site.
In an effort to reduce the environmental impact upon inland water resources, modern nuclear power plants will use sea water cooling at coastal locations or near the mouths of large estuaries such as the Fitzroy or Mary Rivers.
In Table 2 we have listed nine locations based primarily on ensuring sufficient cooling capacity is available. For this reason we have concentrated on coastal locations and major estuaries. Many other sites are available on Queensland’s vast coast line. We have also attempted where possible to minimise grid upgrades.
The tabulation shows the anticipated type of cooling at each plant
An excellent and detailed outline of the cooling options is available at: Cooling Power Plants | Power Plant Water Use for Cooling – World Nuclear Association
Table 2 – Various sites reviewed for Queensland Nuclear Power Plants
| Cooling Resource | Cooling Type | |
| Thompsons Point | Fitzroy River | Estuary |
| Stanwell | Fitzroy River | Freshwater |
| Curtis Island | Keppel Bay | Seawater |
| Boyne River/Tannum Sands | Boyne River | Estuary |
| Hummock Hill Island | Rodd Bay | Seawater |
| Rodd Bay | Rodd Bay | Seawater |
| Miara | Coral Sea | Seawater |
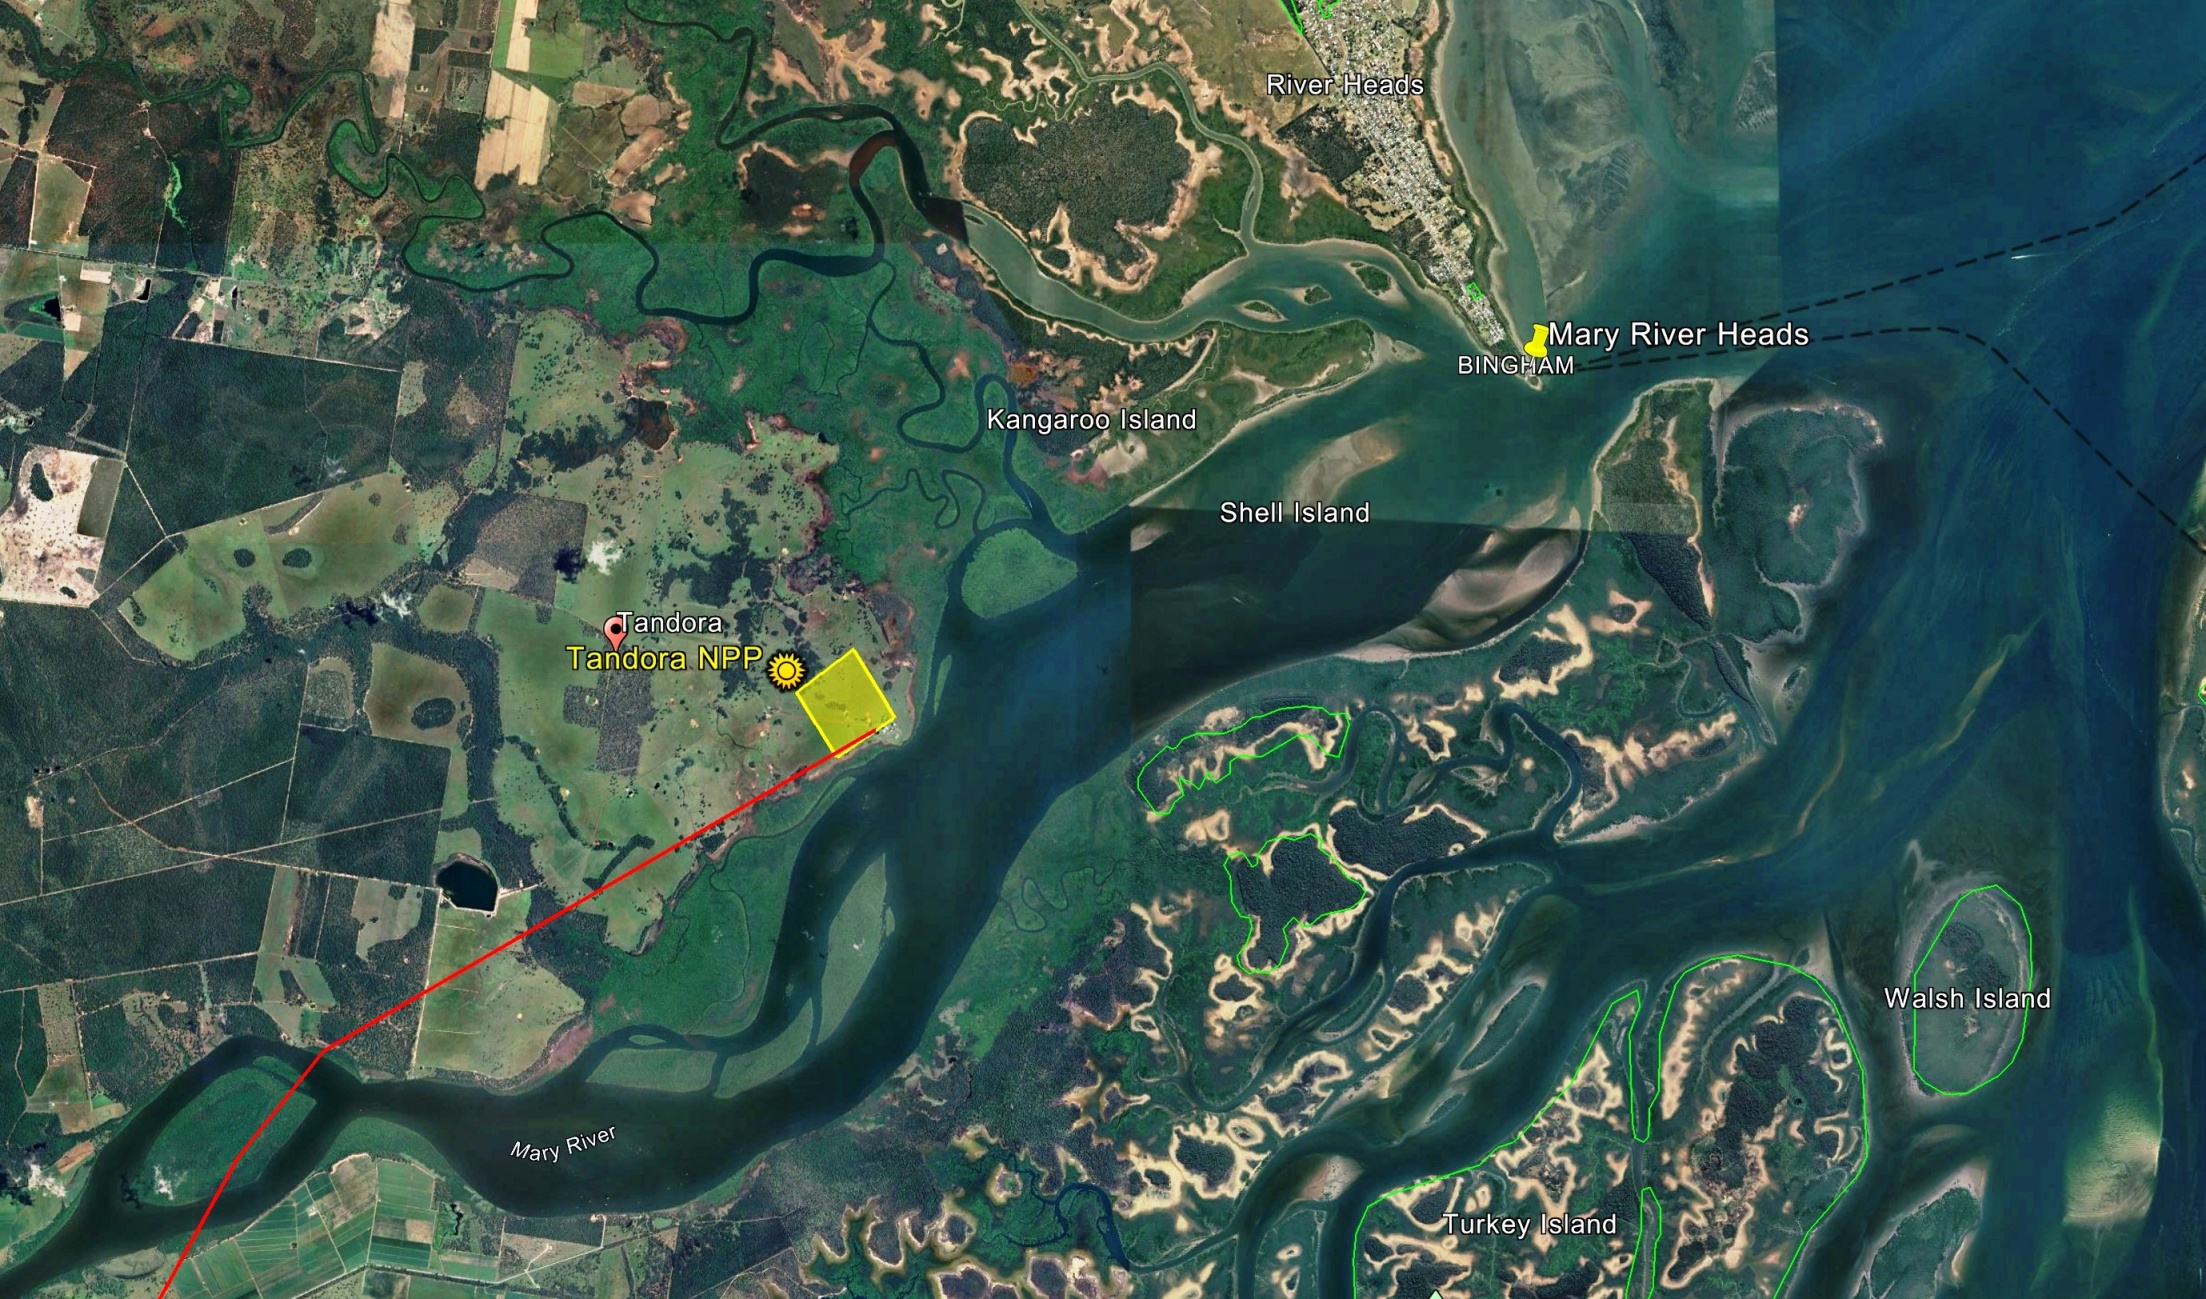
| Tandora | Mary River | Estuary |
| Tinnanbar | Great Sandy Strait | Estuary |
Nuclear power plants can be constructed at most of these sites however on a subjective basis we have selected three sites to enable us to arrive at a costing for grid connections. These are listed in Table 3 – Possible mix to meet planned energy needs.
Table 3 – Possible mix of sites to meet planned energy needs
| Location | 2050 | 2060 | |||
| Capacity MW | Number of Units | Capacity MW | Number of Units | Cooling Type | |
| Thompson Point | 2.8 | 2 | 2.8 | 2 | Estuary |
| Rodd Bay | 2.8 | 2 | 2.8 | 2 | Seawater |
| Tandora | 0 | 0 | 2.8 | 2 | Estuary |
| Total | 5.6 | 4 | 8.4 | 7 | |
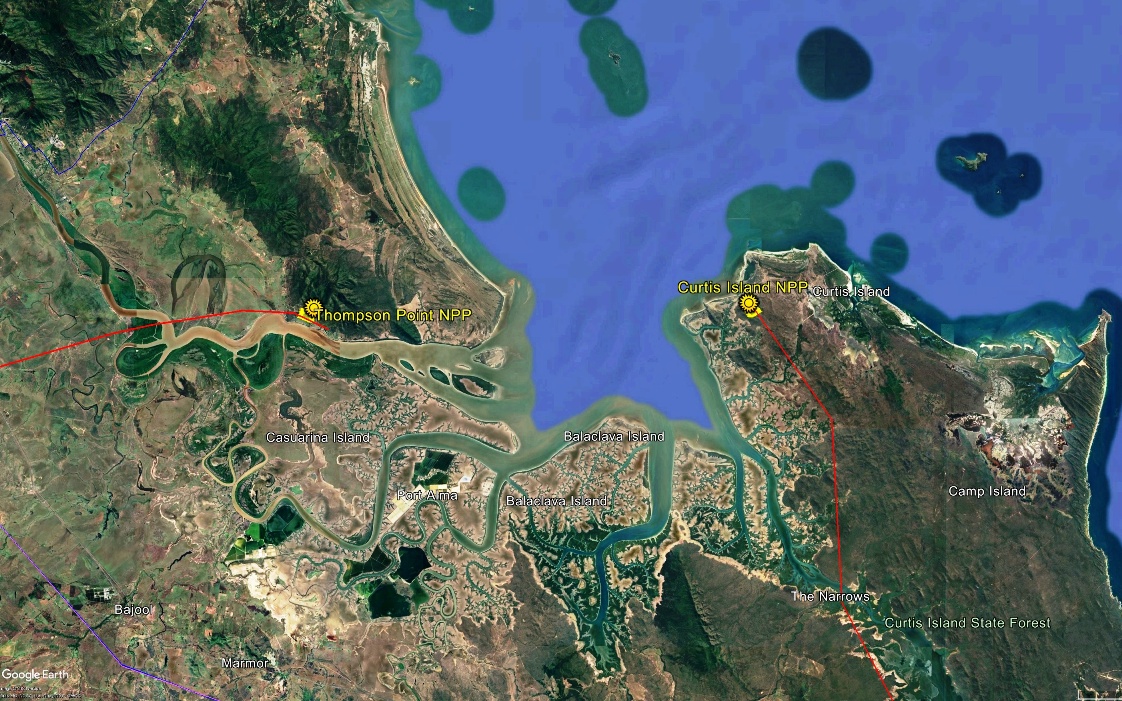
In Figure 1 and in Table 2 the sites considered are Thompsons Point, Curtis Island, Stanwell power station, Boyne River/Tannum Sands, Rodd Bay, Hummock Hill Island, Miara, Tinnanbar and Tandora near Mary River Heads.

Figure 1 Potential Sites for Large Nuclear Power Plants in QLD shown in yellow icons
Costs of Queensland nuclear Power Plants with Transmission Upgrades
Based upon the three locations shown in Table 3 of Thompson Point, Rodd Bay and Tinnanbar the following grid upgrade are allowed for:
- Thompson Point,
- 2800MW generation,
- 500kV to Bauldercombe Substation – 30kM and
- 275kV upgrade from Bauldercombe to Gladstone substation – 83km.
- Transmission line and substation costs – $777 million
- Rodd Bay
- 2800MW generation
- 500kV from Rodd Bay to Gin Gin substation – 109km
- 275kV augmentation Gin Gin – South Pine – 310km
- Transmission line and substation costs – $1,658 million
- Tandora
- 2800MW generation
- 500kV from Tinnanbar to Tarong SS – 182km
- Transmission line and substation costs – $1,443 million
The capital cost used for nuclear power plants reflects the figures quoted in CSIRO’s Gen Cost report and our evaluation of the costs of Saeul Units 3 and 4, the Barakah project in the UAE as well as tendered amounts for South Korean plants in the Czech Republic and Poland.
- Nuclear Power Plants, 8,400MW at $8,655/kW = $72.7 Billion
- Transmission and Substations – $3.88Billion
- Total Cost – $76.58Billion
-
Thompsons Point
- Close to port and transport
- Estuary Saltwater cooling
- Likely rock foundations well above flood inundation
- Nearby large population for construction and operations with well developed industry
- Very low nearby population density
- Moderate distance for grid upgrade
- Has a partially operational railway which can be completed
- Requires access roads and port construction.
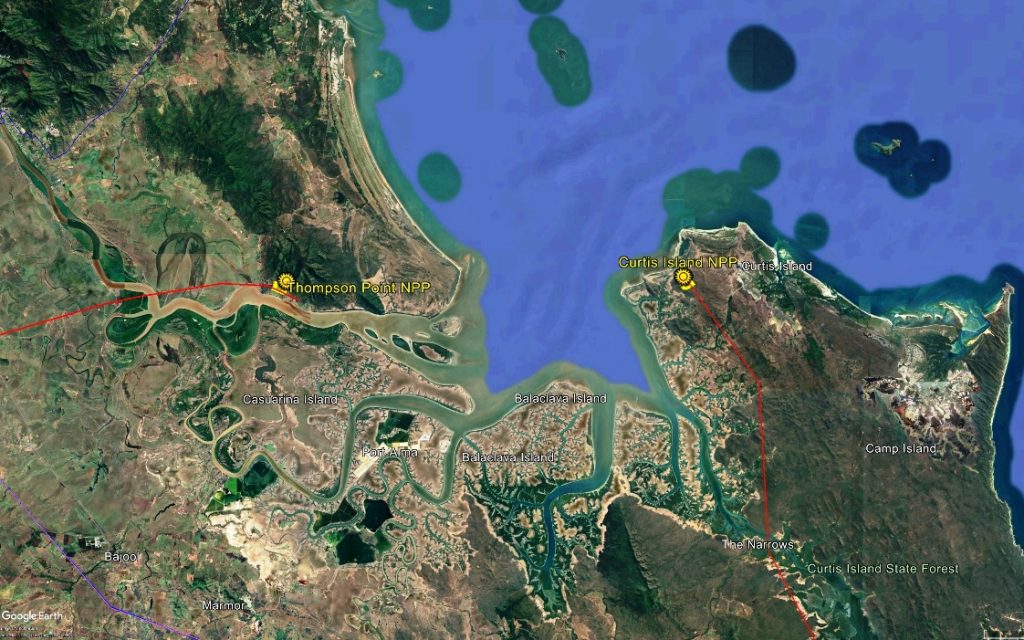
Thompsons Point and Curtis Island
2. Rodd Bay through to Mangrove Bay
- Sea water cooling into Rodd Bay and Rodd Harbour
- Rock Foundations
- Very low population densities.
- Many options along coast line
- Significant road building and infrastructure upgrade for construction
- Transmission construction
- Site Difficult to access – need substantial access construction
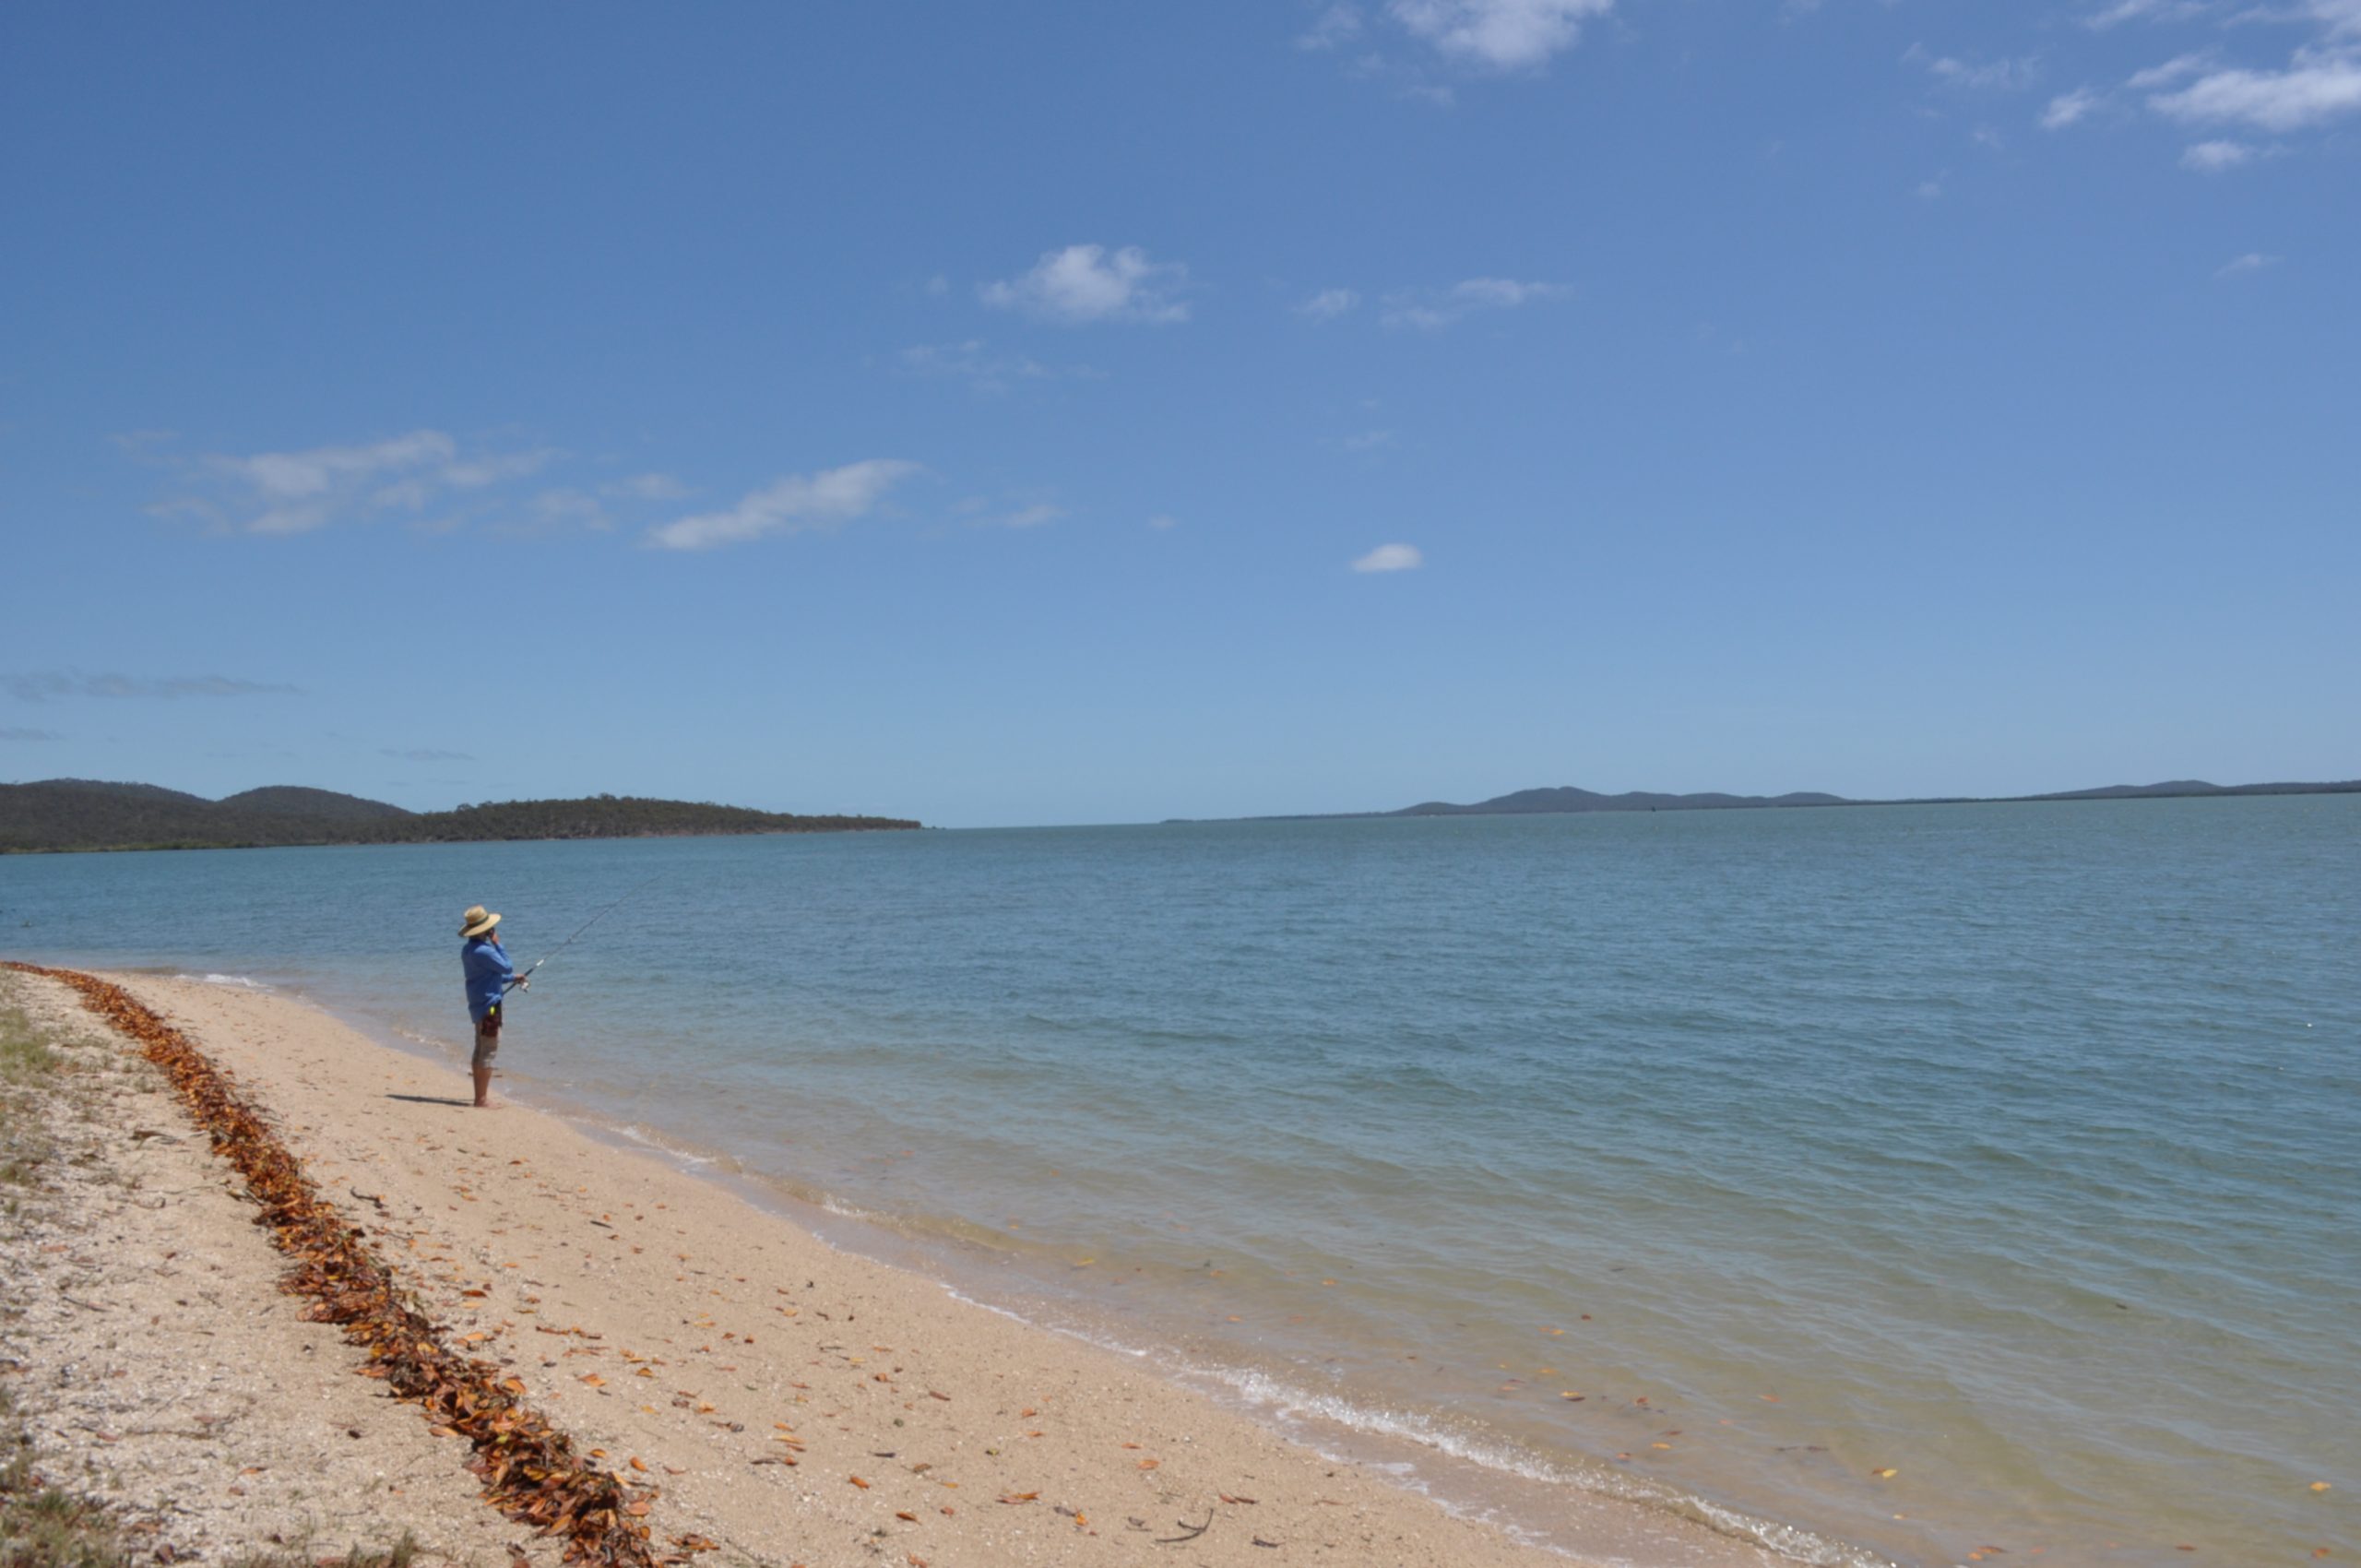
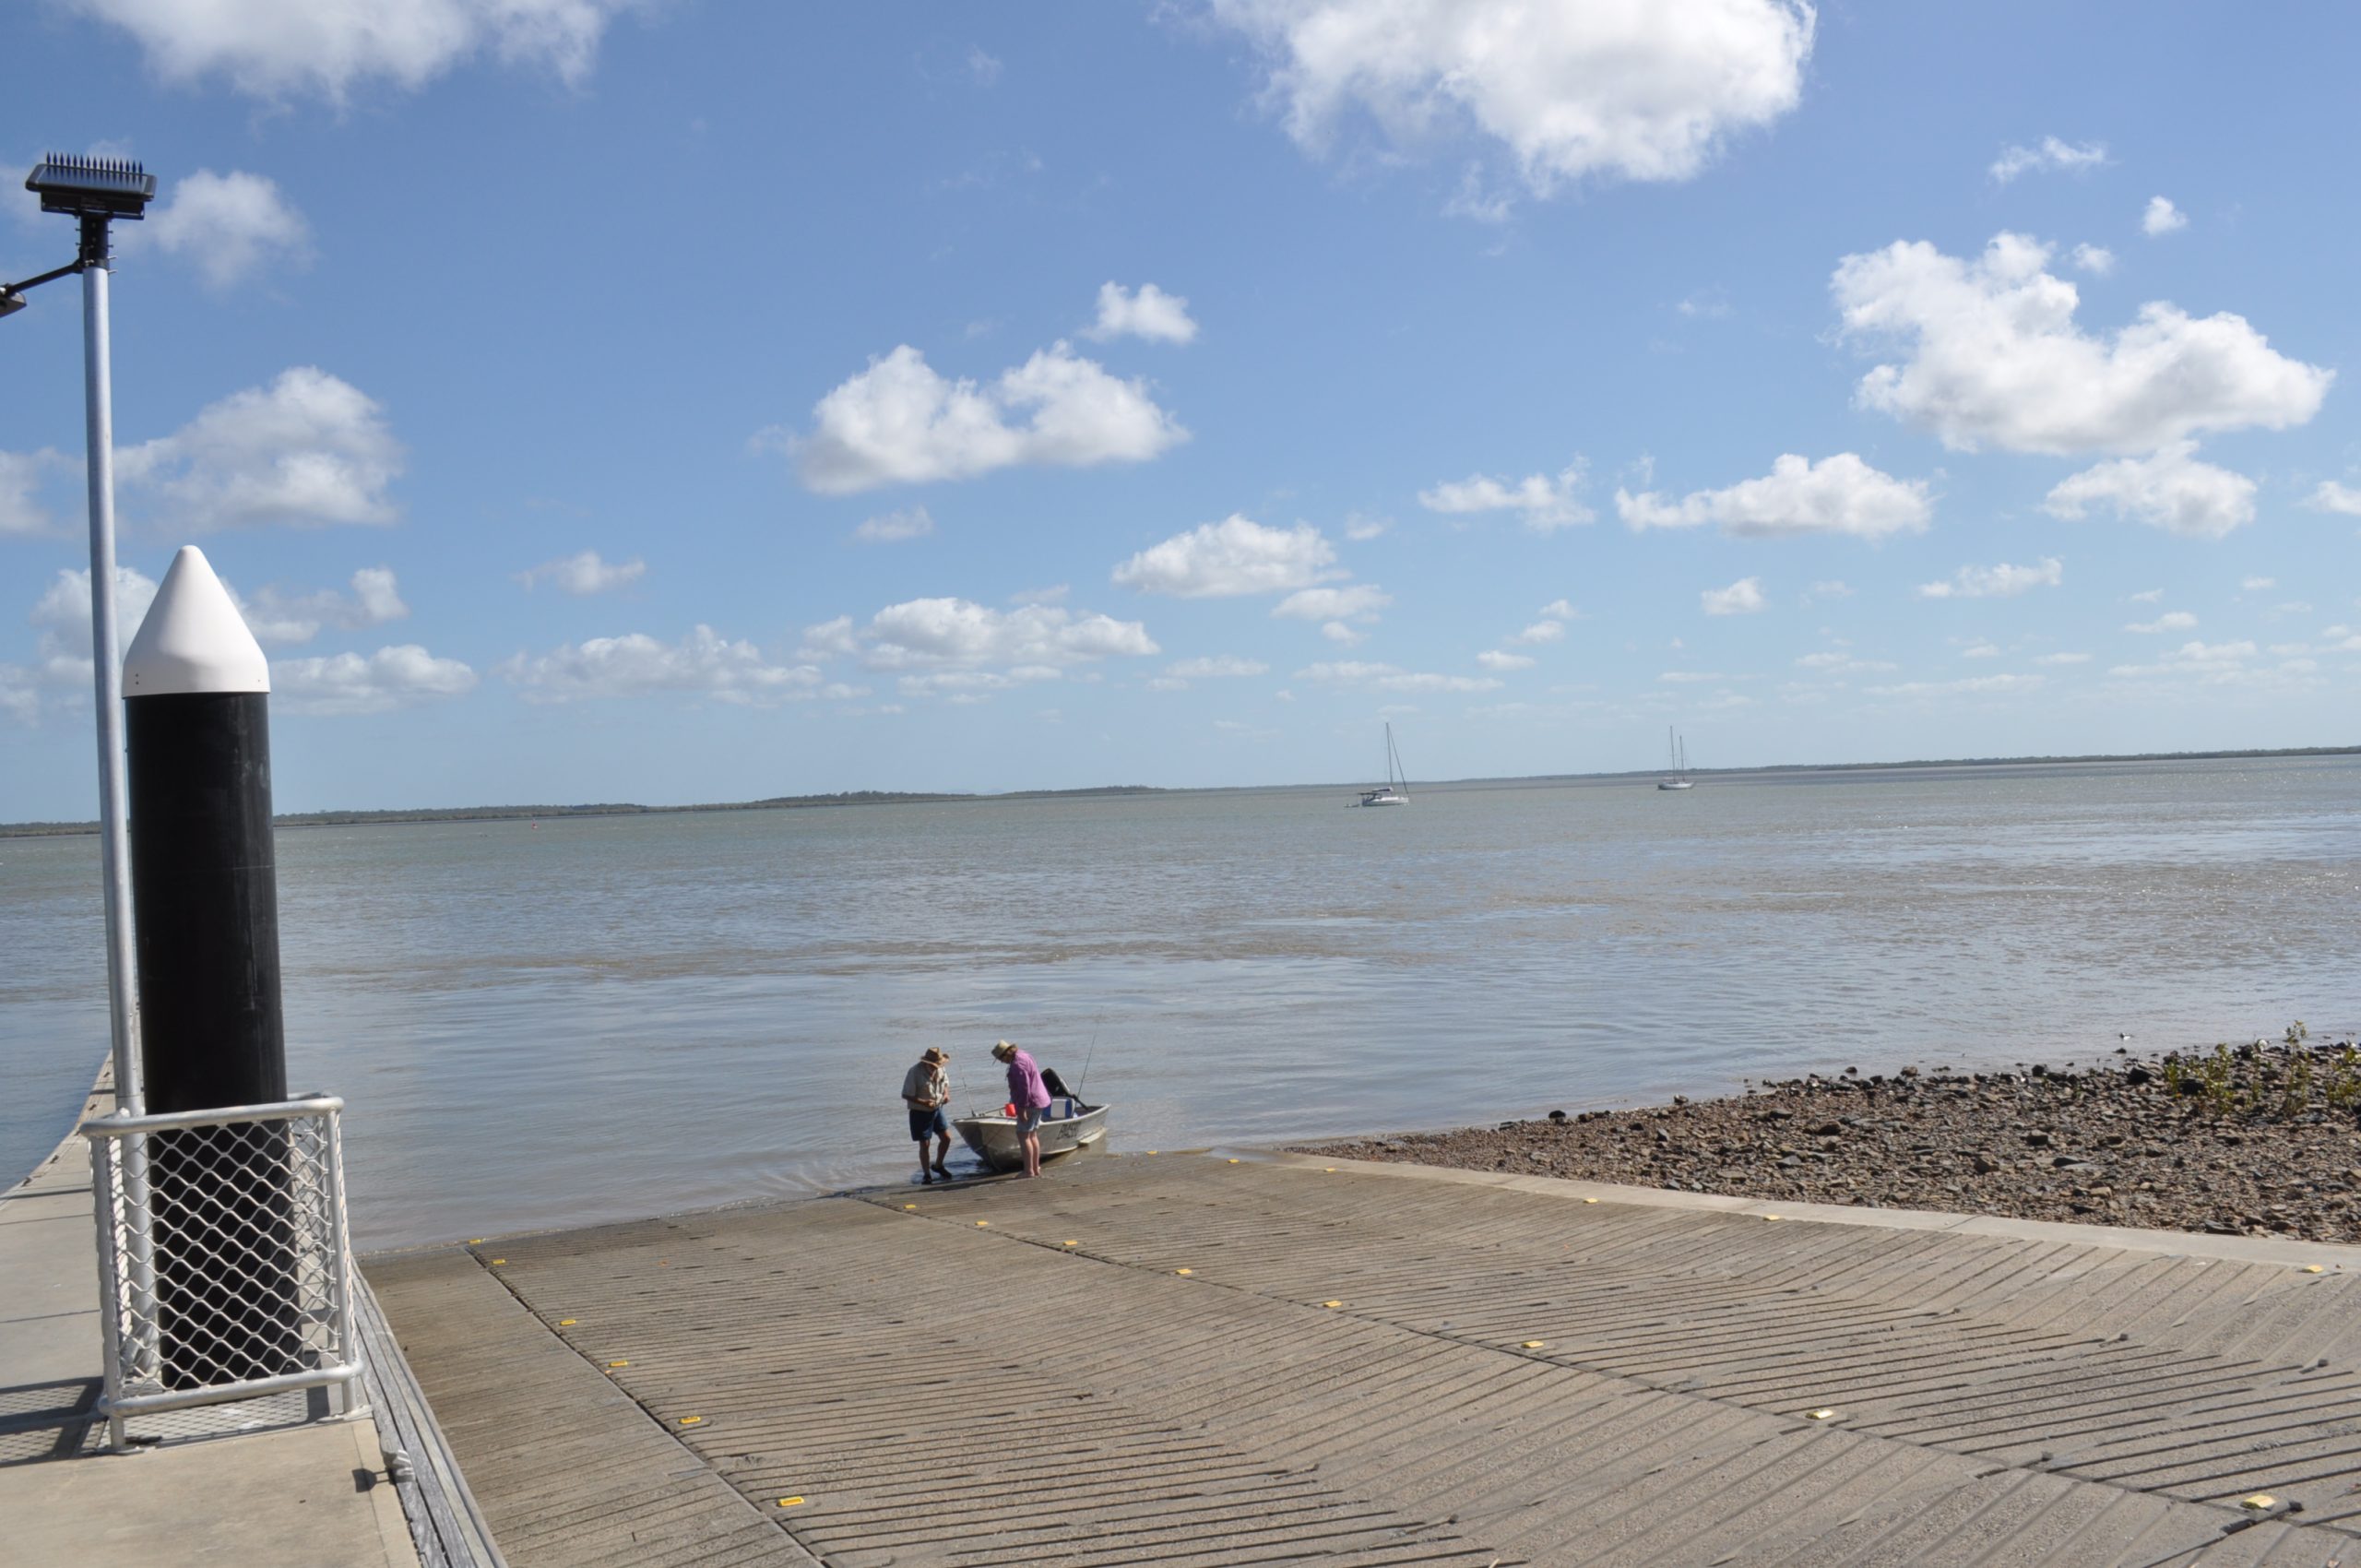
View up to Rodd Bay
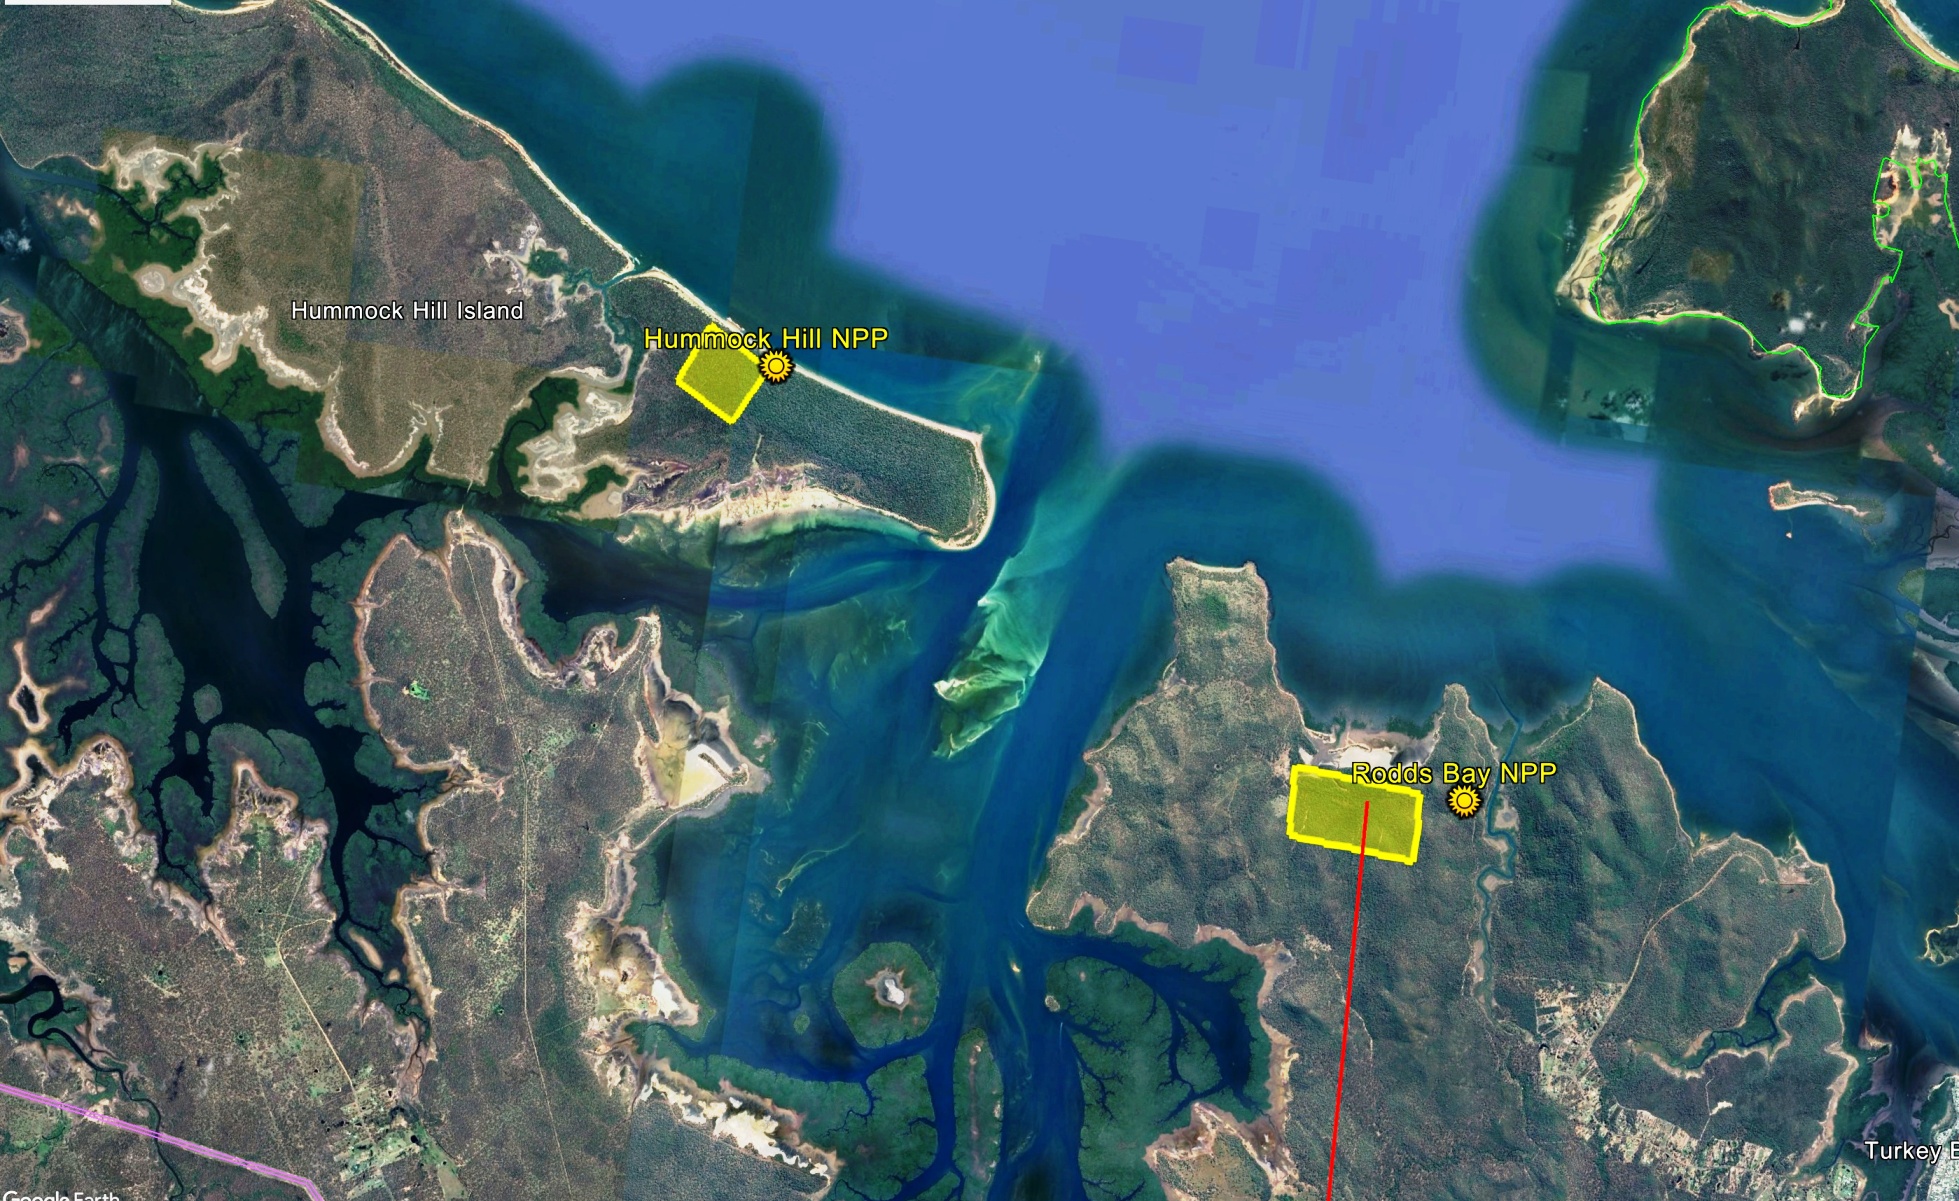
Hummock Hill – Rodd Bay
3. Tandora on Mary River
- Site adjacent to very wide Mary River estuary for cooling and close to headland outlet
- Transport, labour and infrastructure from Maryborough at 15km
- Low surrounding population density
- Road and possible port access to be built
- Requires significant transmission upgrade using 500kV to Tarong substation
View across mary River estuary