
20 Jul NUCLEAR ENERGY – AUSTRALIA’S LEAST COST LOW CARBON ENERGY SOLUTION
![]()
Amended 20/7/2021
Introduction
Angus Taylor has an inquiry going into dispatchable energy and storage options for electricity production. The terms of reference suggest the need to enable Variable Renewable Energy Sources (VRE) such as wind and solar to be integrated into the National Electricity Market (NEM) in a dispatchable or usable form.
Our analysis of AEMO’s Integrated System Plan (ISP) out to 2042 and ultimately to a decarbonised electricity sector demonstrates that a system based on nuclear energy will have much lower costs and achieve carbon reductions more quickly. It will achieve these cost benefits in part by eliminating the need for large amounts of energy storage and the expansion of the existing transmission and distribution system.
Our submission to the inquiry directly compares the costs and emissions profiles of such an integration with those of a nuclear energy based system. The headings in this article address some of the key terms of reference.
Current and Future Needs
The current and future needs are taken to be the current and future annual energy demand on the NEM as outlined in AEMO’s National Electricity Forecasting at http://forecasting.aemo.com.au/Electricity/AnnualConsumption/Operational.
There are a great many scenarios that make up AEMO’s Integrated System Plan 2020. For brevity we quote the current and future electricity demands in 2042 as follows:
| Scenario | Year | Operational Sent out energy (GWh/yr) | Small Non-Scheduled Generators and Roof top PV (GWh/yr) | Total Demand (GWh/yr) |
| Central DP1 | 2021 | 175,717 | 20,910 | 196,627 |
| 2042 | 193,655 | 48,382 | 242,036 | |
| Step Change DP1 | 2021 | 182,177 | ||
| 2042 | 224,887 |
The total demand in 2042 will form the basis of comparison of VRE and Nuclear energy-based systems. Many of the remaining AEMO ISP scenarios could be compared however the relative benefits of nuclear energy will remain.
Existing, new and emerging technologies
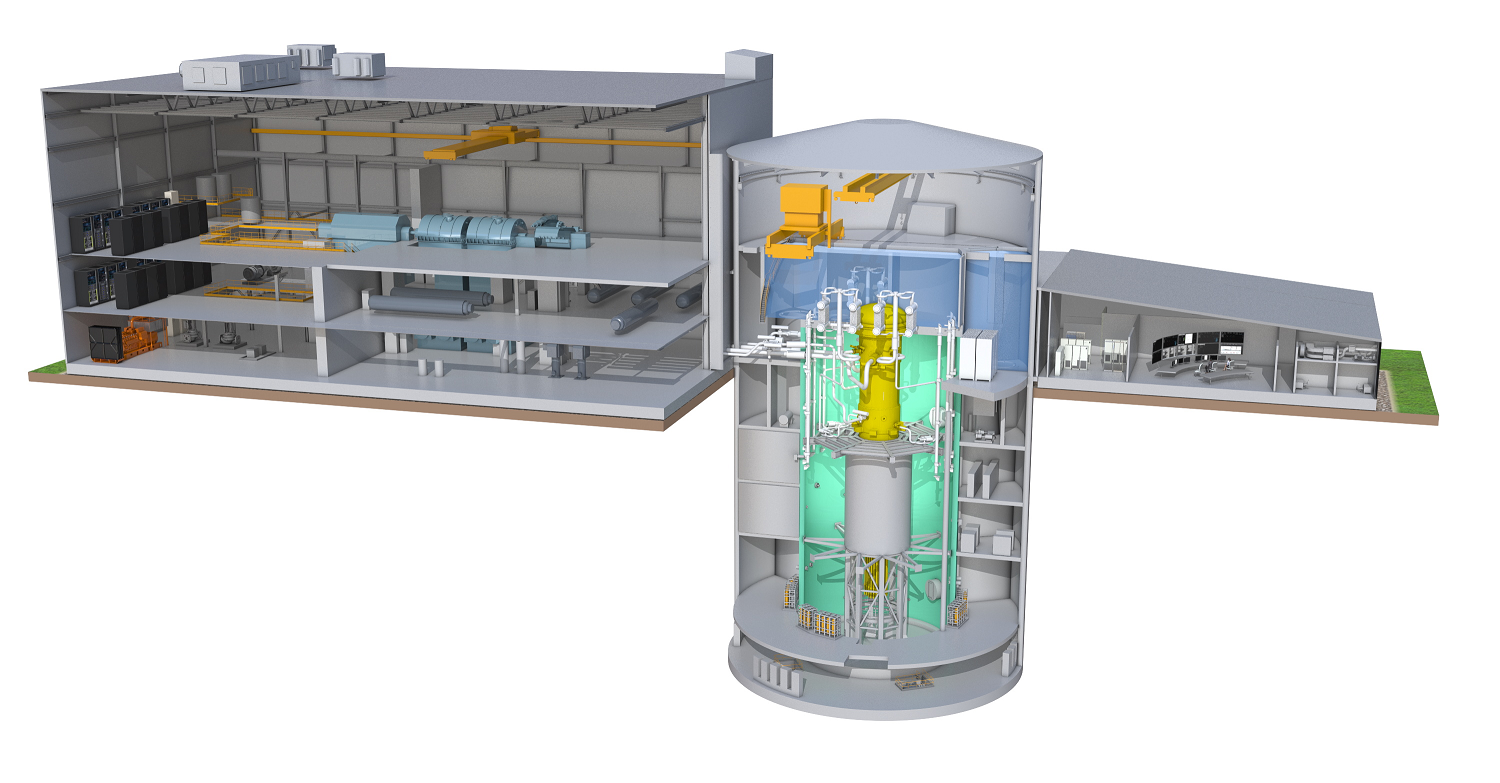
The small nuclear power plant used in this comparison is the General Electric BWRX boiling water nuclear power plant from General Electric Hitachi.
From GE’s promotional material this plant’s benefits are:
- Cost competitive: projected to have significantly less capital cost per MW when compared with a typical water-cooled Small Modular Reactors (SMR)
- World class safety: designed to mitigate loss-of-coolant accidents (LOCA) enabling simpler passive safety – Emergency Planning Zone EPZ limited to site boundary
- Innovative cost-competitive design: designed to allow the Nth-of-a-kind (NOAK) BWRX-300 to be competitive with the levelized cost of electricity of natural gas and renewables
- Passive cooling: designed to allow steam condensation and gravity to cool the reactor for a minimum of seven days without power or operator action
- Quick Deployment: Deployable as early as 2027, thanks to proven know-how, supply chain, components, certified fuel and simpler construction techniques
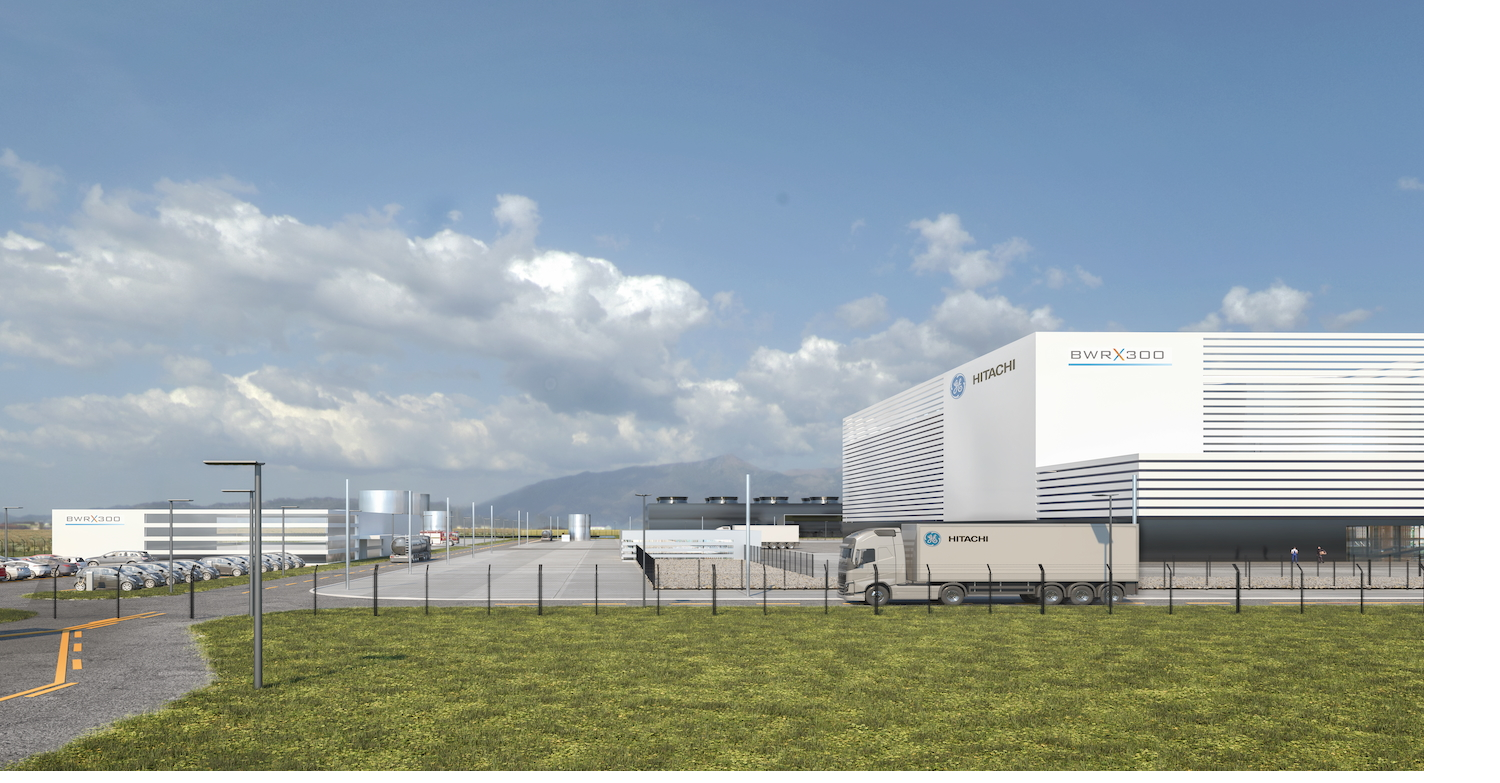
Figure 1 – Anticipated view of BWRX 300 two pack
BWRX 300 boiling water nuclear power plant from GE-Hitachi
US$2,500/kW, Allow A$4,580/Kw or A$1.374 Billion per unit
General Electric are focused on ensuring the BWRX 300 is cost competitive in the very tight North American market where shale gas prices are making other generators uncompetitive. The cost sensitivity is shown in Figure 3 where the BWRX 300 has a significantly lower levelised cost of generation than other nuclear power plants and is on a par with shale gas generation and renewables.
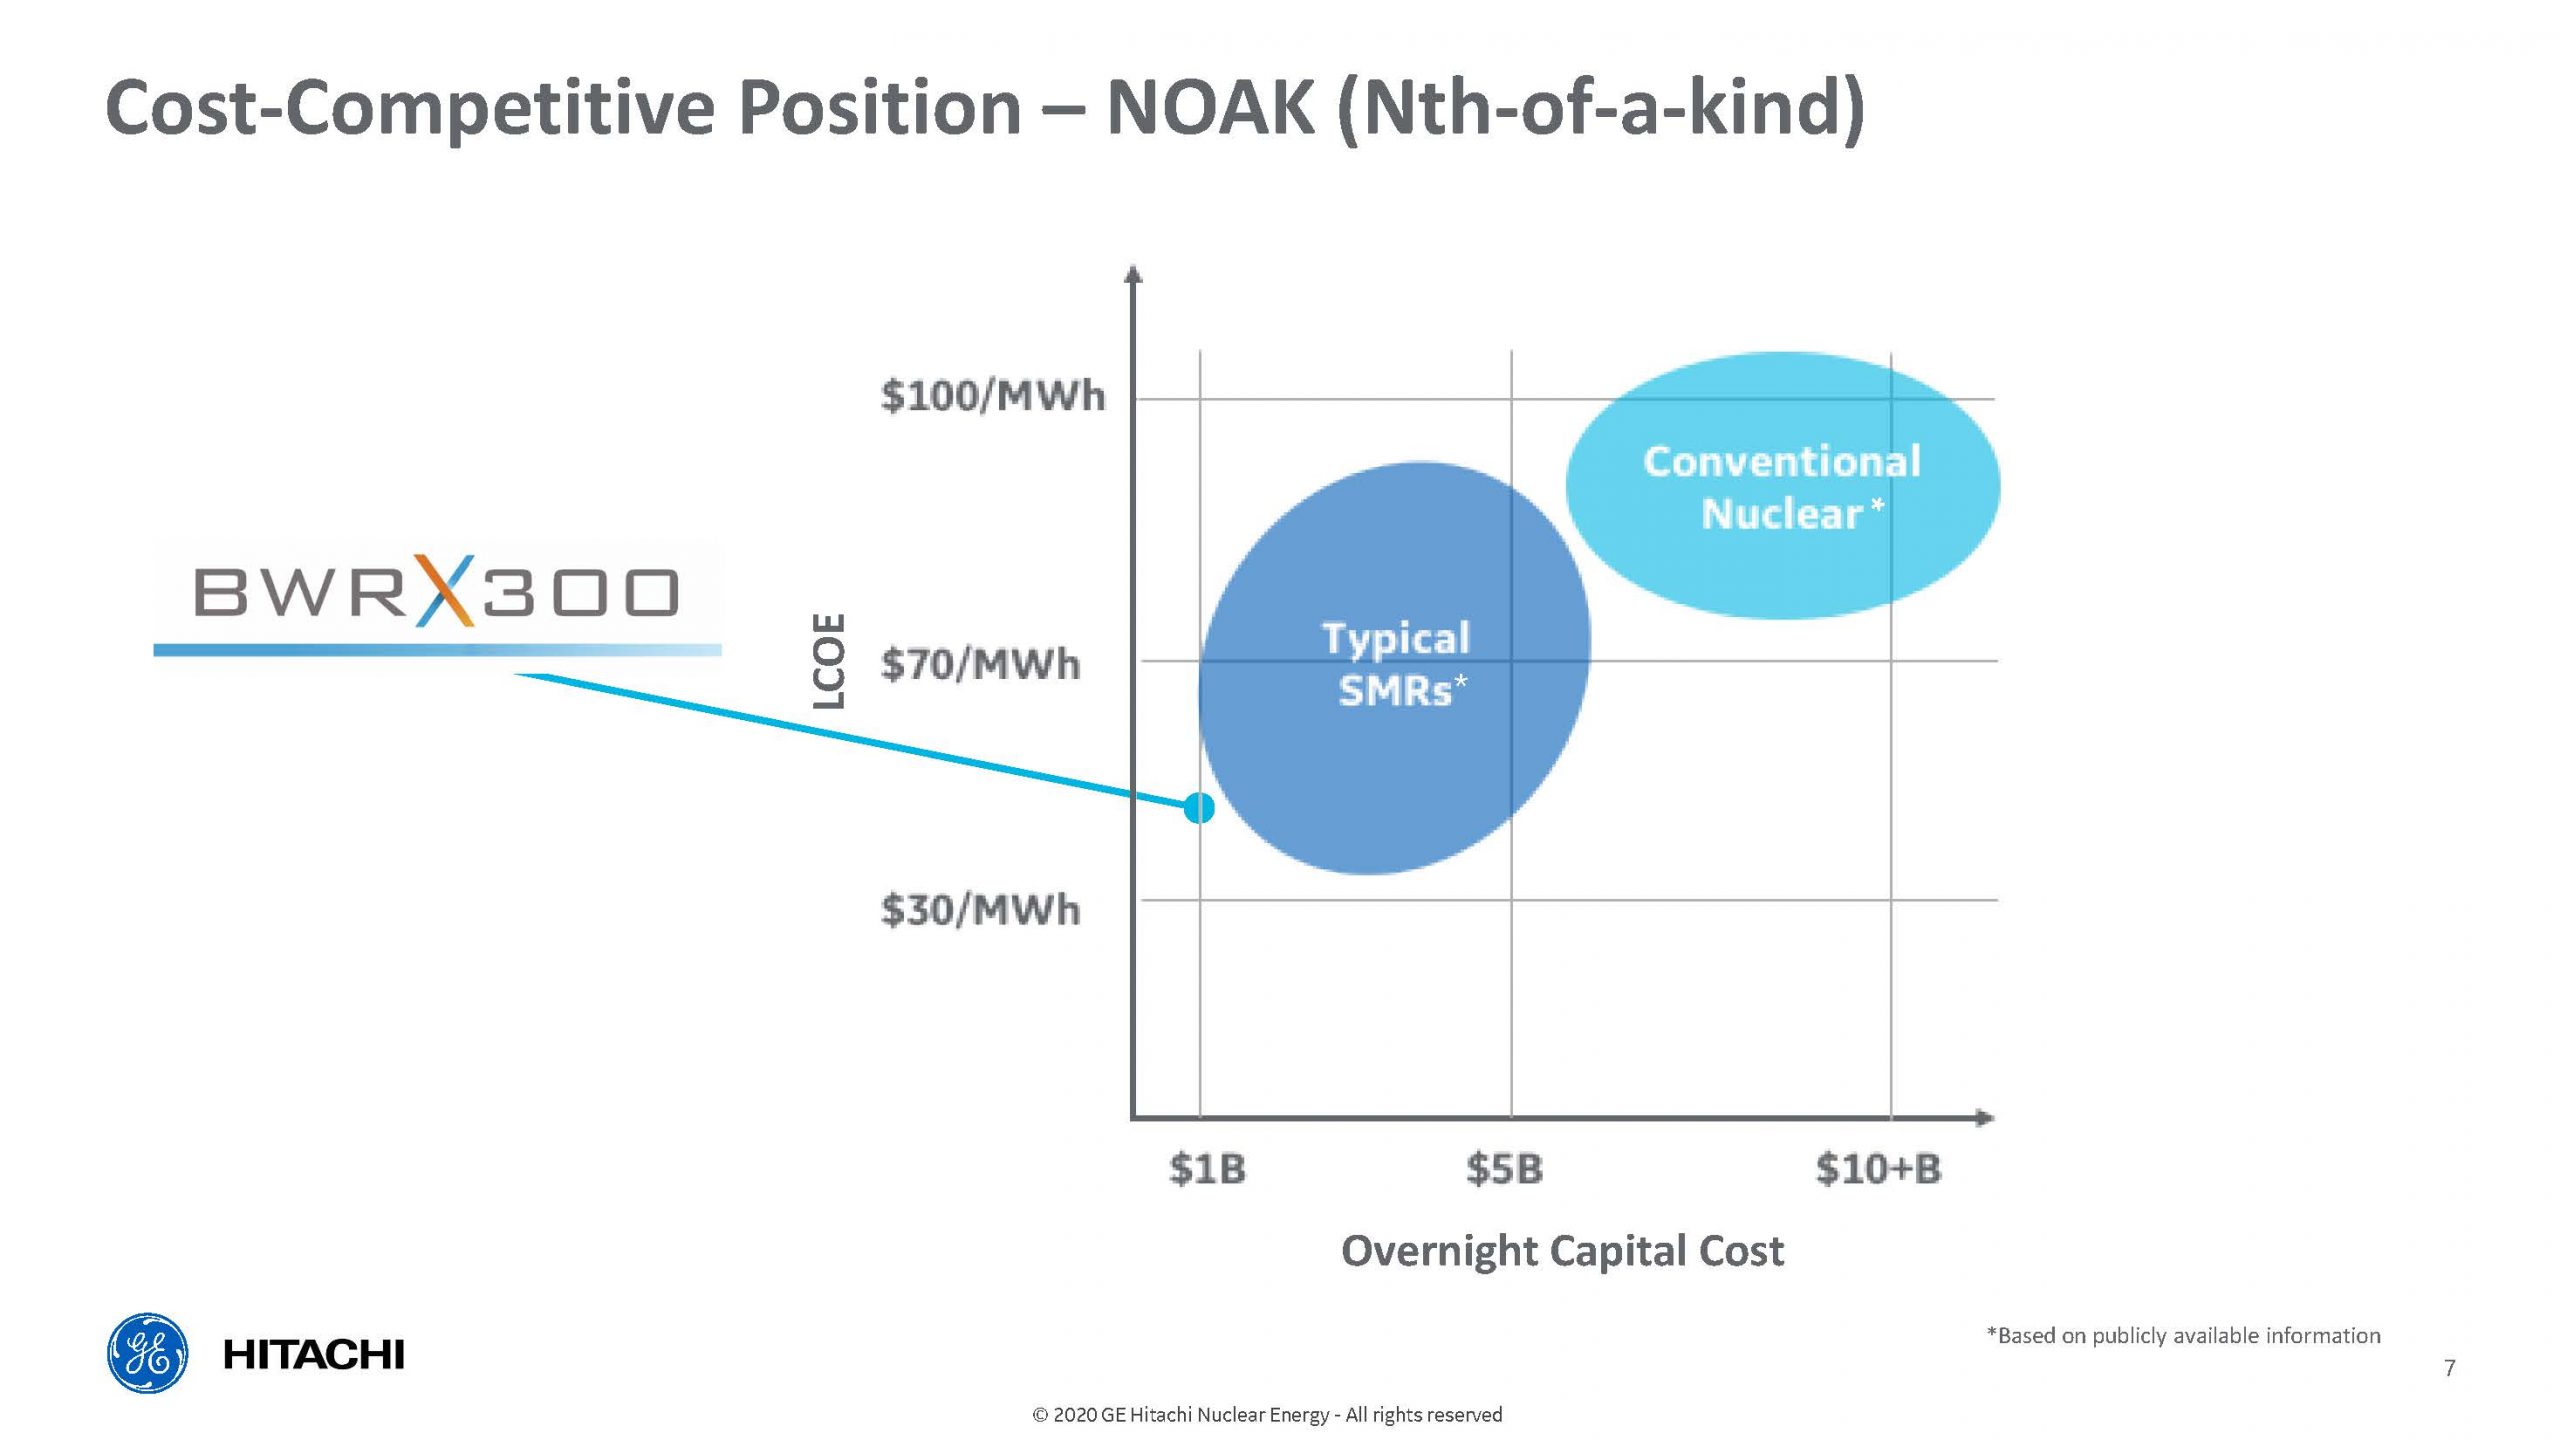
Figure 3 Cost competitive position for the BWRX 300 “Nth of a kind” in US$/MWh on a cost per plant basis
Comparative efficiency, cost, timeliness of development and delivery, and other features of various technologies
The comparative analysis of renewable and nuclear based systems is shown in the charts in Figure 4 and Figure 5. Both comparisons shown are based on the costs for wind, solar, batteries, pumped storage and fossil fuel generators derived from CSIRO Gen Cost 2020-21. The cost for nuclear energy is based upon the publicly available General Electric (GE) anticipated cost adjusted for deployment in Australia.
https://nuclear.gepower.com/build-a-plant/products/nuclear-power-plants-overview/bwrx-300
For the purposes of this comparison we have used a capital cost of A$4,580/kW for the GE BWRX 300 small nuclear power plant. Further significant gains are also made in the staffing levels and so the operational values used are A$8.47/MWh for fuel and A$16.72/MWh for operations.
Figure 4 utilises CSIRO costs in 2021 for each technology. Much is made of the future anticipated cost reductions for batteries, solar and wind technologies. These reduced values are reflected in Figure 5. While the costs of a fleet of small nuclear power plants would also decline with time, this has not been assumed in our comparisons.
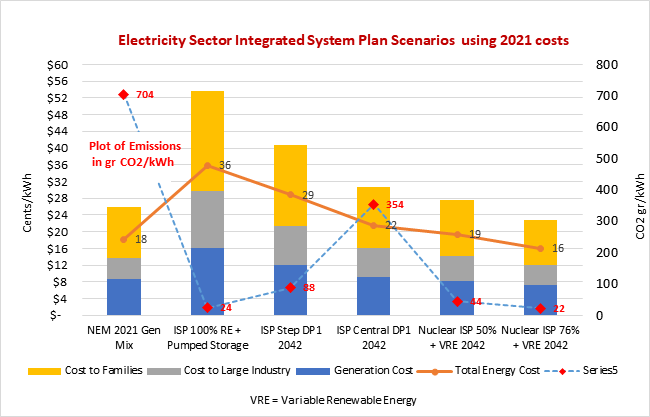
Figure 4
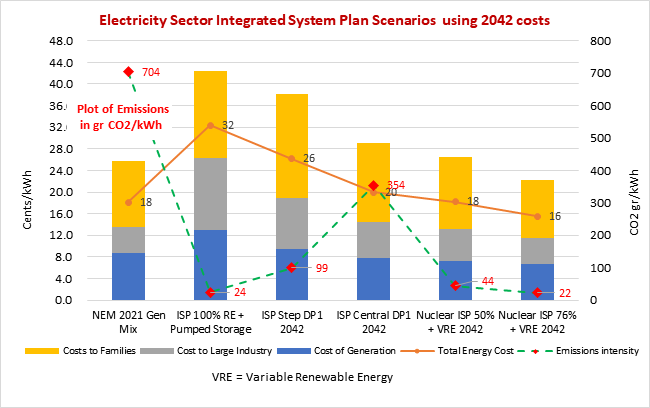
Figure 5
Comparison assumptions and outcomes
Six energy plans are shown in the charts. Each energy plan has been run through the Electric Power Consulting’s Energy Model. The model matches a mix of energy generators and storage devices to meet the demand on the National Electricity Market (NEM) which uses about 199TWh/year.
It contains demand data for three consecutive years from 2017. The demand is measured at half hour intervals.
Inputs into the model include:
- Capital costs
- Fixed and variable operational costs
- Discount rates,
- Min and max generation limits for each generator
- Ramp rates
- Carbon emissions both from combustion and embedded.
- Arbitrage options
- Transmission, Distribution, loss factors and retail margins
Using these inputs the model derives the System Levelised Costs of Energy (SLCOE) and energy prices to wholesale and low voltage retail customers.
The model also calculates the actual shares of energy for each generator, capacity factors and costs of carbon abatement.
Description of the six energy plans:
- NEM 2021 Gen Mix – this uses the existing NEM based mix of coal, gas, wind, solar and hydro with the existing transmission, distribution and ancillary services costs. It is intended to act as a “control” for subsequent plans and demonstrate the correct order of costs and emissions.
- ISP 100% RE + Pumped Storage – This plan uses wind, roof top and utility level solar and existing hydro as the generators. Storage is provided by 5.1GW of batteries and 21GW of pumped hydro.
- ISP Step DP1 – This plan was determined by AEMO and uses the residue of coal plants, existing hydro, combined and open cycle plants, plus wind and roof top and utility grade solar. Storage is provided by 12.8GW of batteries and 9.7 GW od pumped hydro.
- ISP Central DP1 – This plan determined by AEMO is a less aggressive option than the Step Change and uses more coal and gas. Storage is provided by 6.6GW of batteries and 7.7GW of pumped storage.
- Nuclear ISP 50% + VRE 2042. This plan eliminates coal use and allows for the use of 15.25GW of small nuclear power plants which would amount to 54 generating units on the NEM grouped in large plants in the same manner as our existing coal plants have multiples of coal generators. They would be located primarily at the sites of existing coal and gas generators or close by the grid at coastal locations. Additional generation is provided by 7.1GW of existing hydro, 2.5GW of open cycle gas, 11 GW of wind and 41 GW of roof top and utility solar. Storage is provided by 6.5 GW of Pumped Hydro and 7GW of batteries.
- Nuclear ISP 76% + VRE 2042. This plan eliminates all coal and gas. It also eliminates the use of wind energy due to its high reliance on gas energy as a backup resource. It utilises 23GW of small nuclear power plants amounting to 82 generating units on the NEM grouped in large plants. They would be located primarily at the sites of existing coal and gas generators or close by the grid at coastal locations. Additional generation is provided by1GW of existing hydro and 22.5 GW of roof top and utility solar. Storage is provided by 4 GW of pumped hydro and 4.5GW of batteries.
Results of Comparison
Both the 2021 and 2042 CSIRO cost base scenarios, plus our assessment of the GE plant, show significant cost benefits when nuclear energy is included in the mix compared to systems based on exclusively on variable renewables. These results are consistent with a recent OECD[i] study of the Texas ERCOT (Electricity Reliability Council of Texas) system. This highlighted the impact that variable wind and solar have on electricity system costs and the cost of the extra backup generators, costly transmission lines and excess capacity required.
In particular, the plan which deploys 76% of nuclear energy is the least cost and eliminates all fossil fuel combustion. Its minor emissions of 22 gr CO2/kWh are derived from embodied carbon in the construction of all the generators.
|
Plan |
Costs of Generation | Costs to Large Industry | Cost to Families and Low Voltage consumers | Cost compared to NEM 2021 Gen Mix | Emissions intensity
gr CO2/kWh |
| NEM 2021 Gen Mix | $87 | $136 | $258 | 1.00 | 704 |
| ISP 100% RE + Pumped Storage | $162 | $297 | $459 | 1.78 | 24 |
| ISP Step DP1 2042 | $120 | $214 | $408 | 1.58 | 88 |
| ISP Central DP1 2042 | $92 | $160 | $306 | 1.19 | 354 |
| Nuclear ISP 50% + VRE 2042 | $82 | $142 | $276 | 1.07 | 44 |
| Nuclear ISP 76% + VRE 2042 | $72 |
$119 |
$227 | 0.88 | 22 |
System Management – a grounding in reality
The use of nuclear energy on the NEM would provide a system free from the consequences and complexity of juggling a variable renewable system with all attendant storage and ancillary services costs.
Figure 6 shows the interaction of the generators and storage required to meet the load. The nuclear power plants are running at high and economic capacity factors of 84% and are meeting the base load power demand. During the daily cyclic demand, a combination of the existing hydro plus solar and storage are meeting the load. The option exists to substitute open cycle gas plants for some of the storage at a modest overall emissions intensity of an additional 10 – 20 gr CO2/kWh.
Reference to international examples.
This system has precedent – it’s very similar to that deployed in France for the past 30 years and has created amongst the lowest cost energy systems in the EU. France built 63 GW of nuclear energy over a 22 year period. Their Generation II plants had a materials intensity at least double that of the modern BWRX 300 plants. In effect Australia, with only 23 GW of installation, would be set with a construction project consuming about 20% of the effort made by France in the 1970’s to 1990’s.
Only a massive loss of confidence would prevent Australia from doing the job in one or two decades.
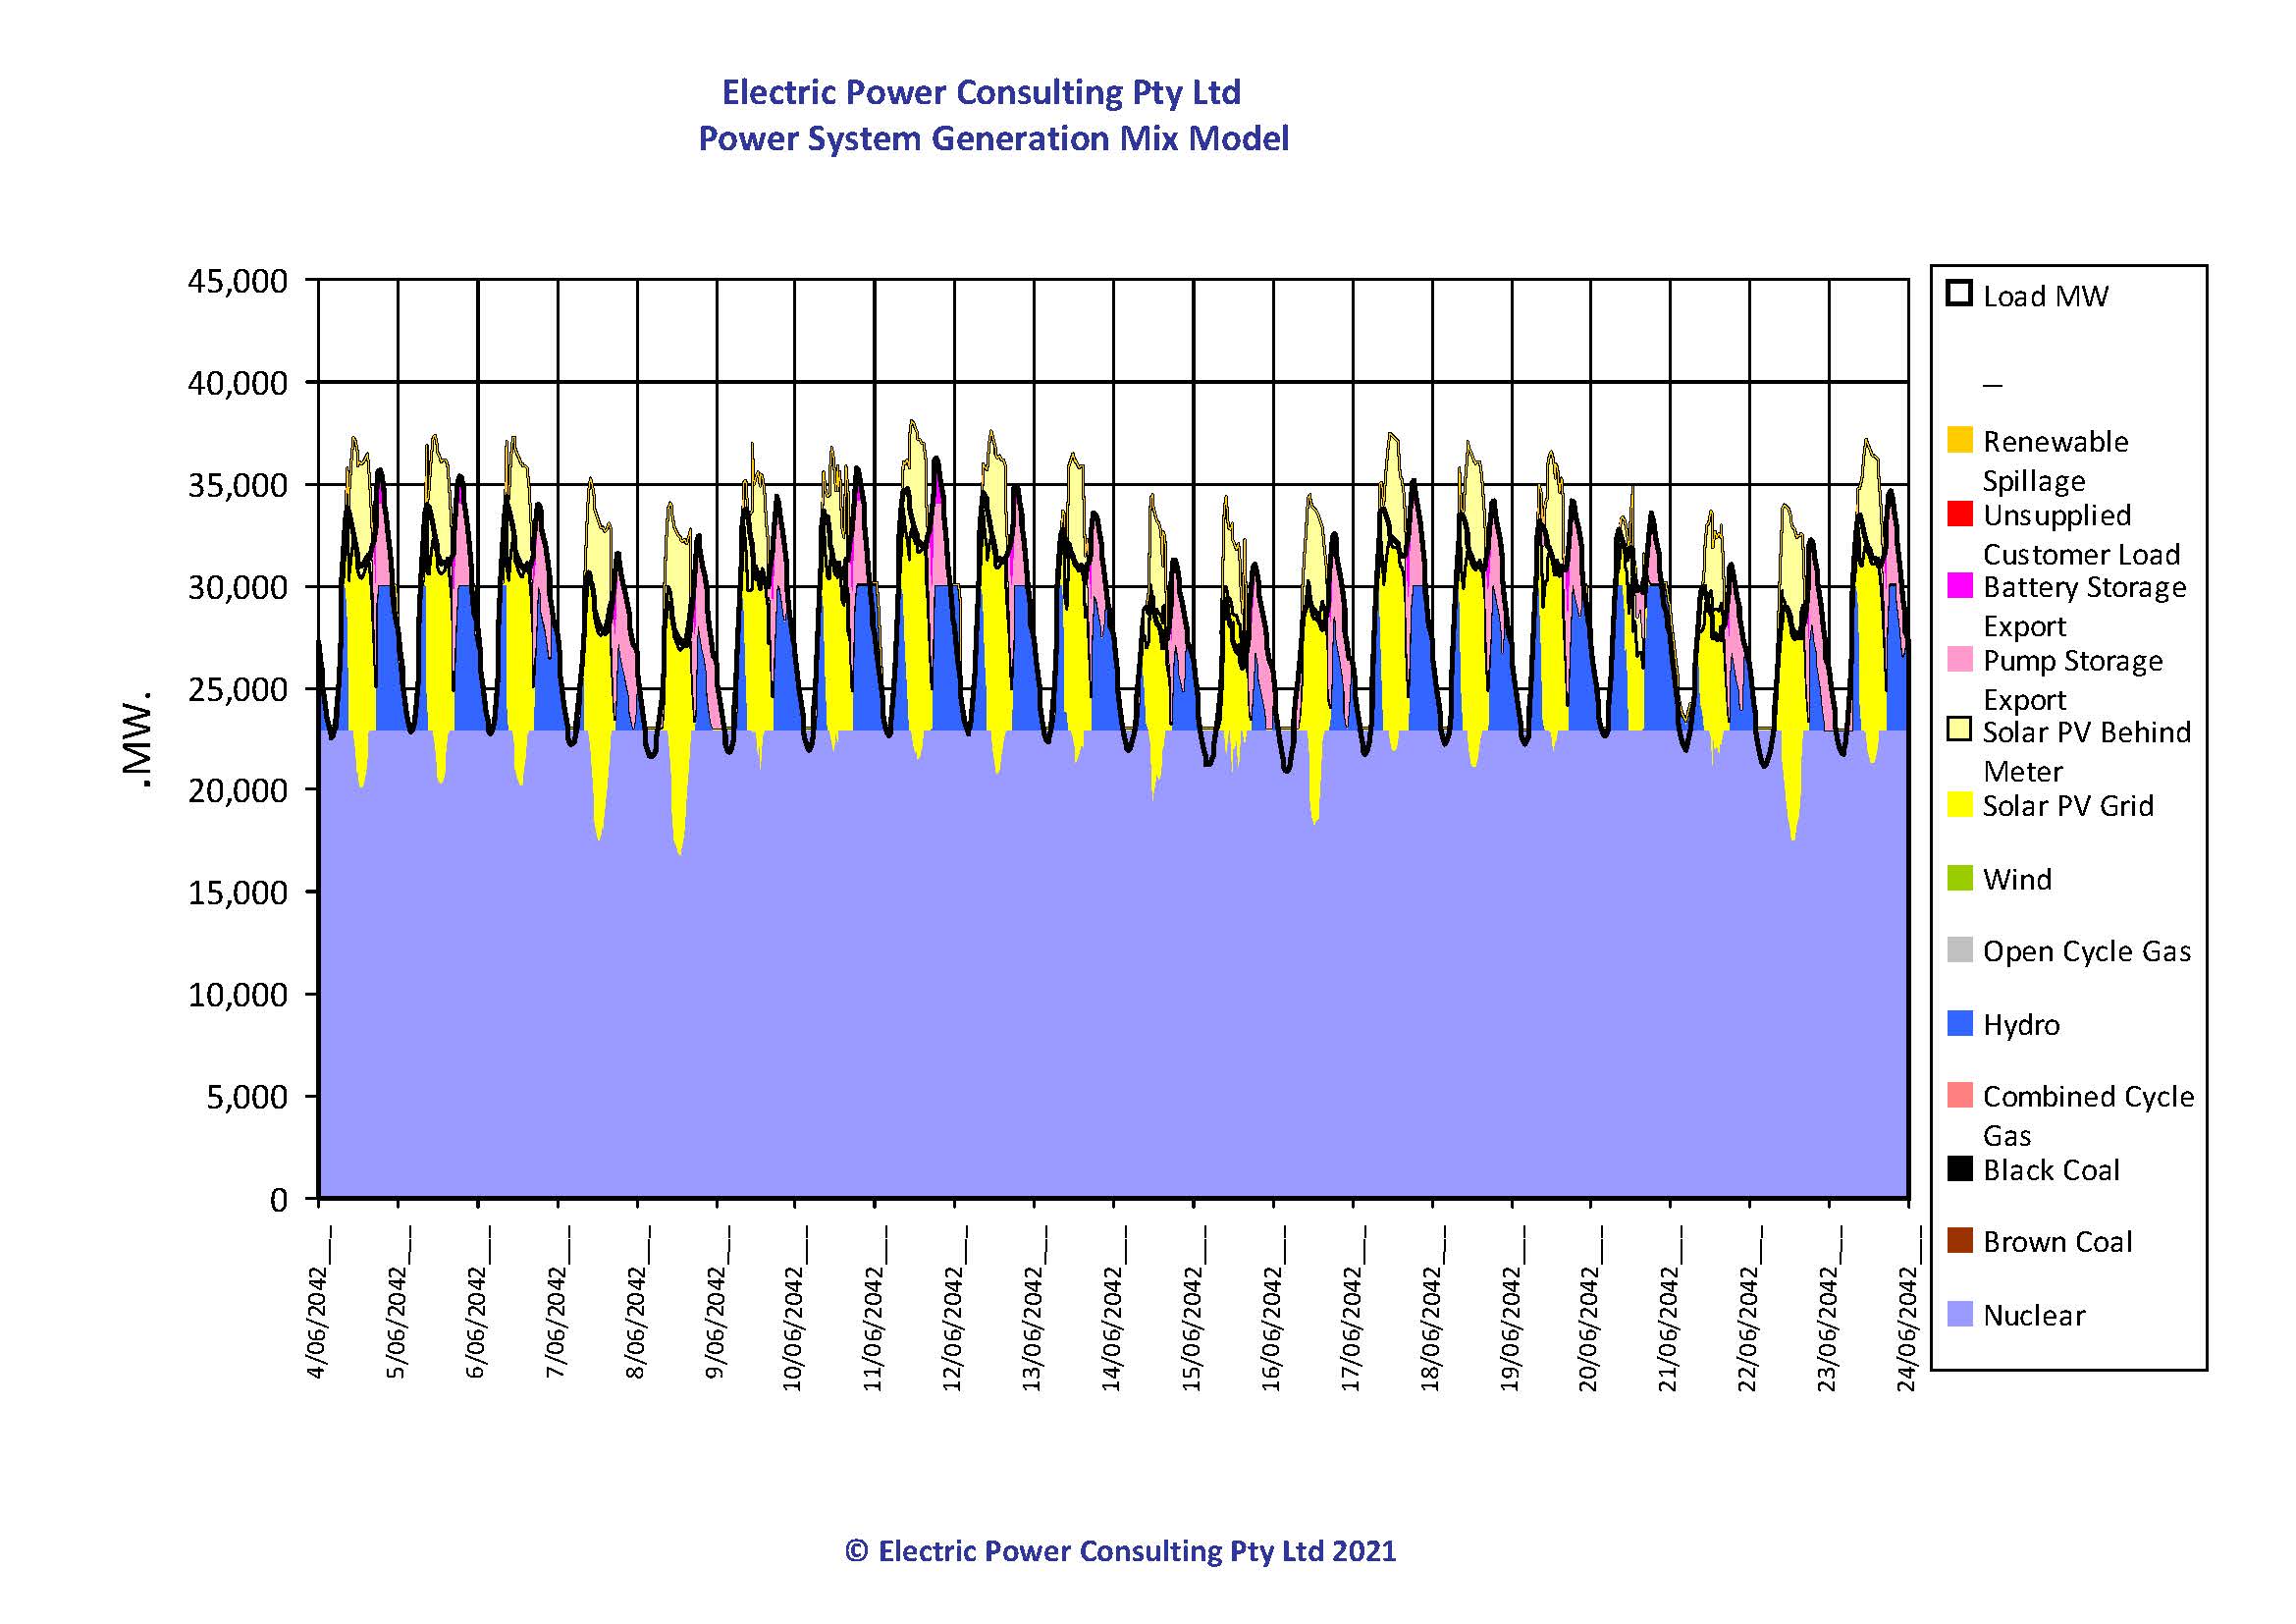
Figure 6 – Nuclear ISP 76% + VRE
In Figure 7 and Figure 9 we see examples of the complex juggling act required to manage systems dependent on variable renewable energy with storage. In figure 8 we see the large amount of surplus solar that is “spilled” under VRE systems. It’s highly variable occurrence on a daily basis means its use in hydrogen manufacture is problematic. In figure 9 we also see the problem of managing coal plants with high levels of solar. These will have vacated the market long before this type of operation is attempted.
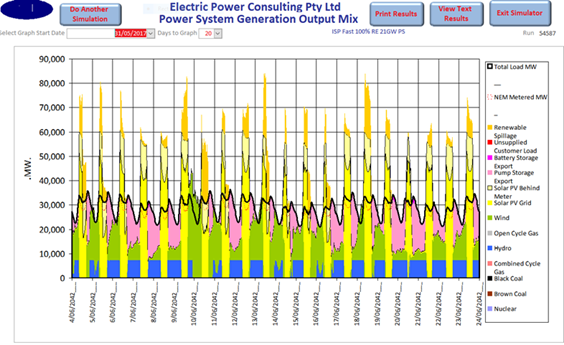
Figure 7 – ISP 100% RE + Pumped Storage
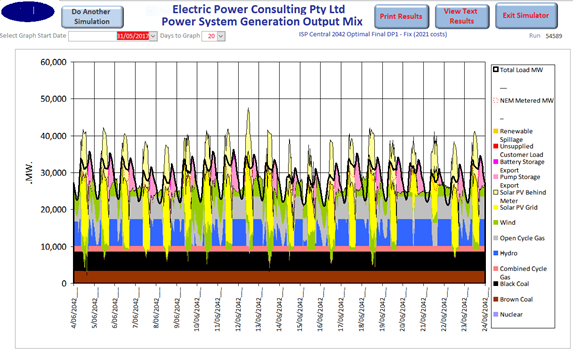
Figure 8 – ISP Central DP1
Concluding Remarks
Under the current NEM market structure no investment in base load generation or even large scale pumped hydro storage will take place without Government intervention. Therefore to enable Australia to have a low cost, low carbon electricity system will require mechanisms to be put into place that guarantee a return on investment and ensure consumers are insulated from excessive financing costs.
As can be seen from Figure 4 and Figure 5 the costs of energy generation is a minor portion of the total cost of electricity yet the type of generator determines the scale of transmission required. We must focus on keeping the costs of transmission and distribution to a minimum if we are to have competitive electricity prices.
A system using high levels of nuclear energy:
- Maximises the benefits of the existing transmission and distribution system and existing transport and cooling resources
- Eliminates the need for large amounts of storage and grid expansion
- Minimises the impact of weather induced risks.
- Will operate reliably and economically for at least 80 years and save on the vast costs of periodic replacements required by wind, solar and batteries.
Such a system will provide a large number of very highly skilled jobs and stabilise local communities. It will provide a massive lift in the levels of education and security to regional Australia and along the way it eliminates carbon emissions to the electricity sector.
Robert Parker
Founder of Nuclear For Climate Australia
[i] THE COSTS OF DECARBONISATION: SYSTEM COSTS WITH HIGH SHARES OF NUCLEAR AND RENEWABLES, NEA No. 7299, © OECD 2019
A PDF version of this post is available at the following link
NUCLEAR ENERGY – AUSTRALIA’S LEAST COST LO W CARBON ENERGY SOLUTION
Eric Meyer
Posted at 14:20h, 10 MayWell done! Haven’t seen a path to carbon free more clearly articulated than this.
Rob Parker
Posted at 15:54h, 10 MayEric,
Thank you for your endorsement.
The analytical tool we use is an energy model developed by Dr Robert Barr of Electric Power Consulting here in New South Wales.
He’s a very bright guy.
I ran stacks of generation mixes to arrive at our result.
It would be great follow up with a demonstration via a Teams meeting or similar
Thanks for all your continued work on nuclear and it would be great to hear you sing sometime – maybe when we can travel again.
Regards
Rob
Peter Cunningham
Posted at 11:50h, 12 MayAgain, a MOST EXCELLENT presentation by Rob – the most tenacious bloke I know!.
The REAL battle isn’t Nuclear – it’s being rid of the political biases and agendas and the hypocritical and idealistic Greens that are on many fronts strangling this nation.
What a pity Australia does not act to introduce the modern nuclear process with equal gusto as it did with the China Virus.
Jim Bain
Posted at 15:38h, 13 OctoberVery well articulated Rob. A solid way forward to zero emissions by 2050 as shown by new nuclear generation coming on stream in France, UK and other countries. A bonus is the additional local industry generated from Australia’s dominant uranium deposits.
geoff hendrick
Posted at 16:38h, 30 OctoberA very informative high-quality report!
Your report says nuclear (SMR 76% option 2042) is half cost of renewables.
But the CSIRO annual gencost report says renewables (including transmission, storage) is half cost of nuclear (2040).
How can we reconcile these 2 reports?
Rob Parker
Posted at 09:45h, 31 OctoberGeoff
Actually we report that 76% nuclear is required. That can be from large or small plants
As German press is reporting, the cost of the recent public offerings for new Polish Plants are #,178/kWe for the South Korean plants, $4,671/kWe for the US plants and $4,898/kWe for French plants
CSIRO are unable to point to any small plants that are likely to be built that comes to $16,200/Kwe
We have actively engaged with suppliers and purchasers of new small modular reactors and to our knowledge CSIRO have not.
CSIRO also make extravagant claims for future cost reductions in wind and solar which do not take proper account of future materials demand for renewables
In Match 2022 the IEA produced a revised version of “The Role of Critical Minerals in Clean Energy Transitions”
If renewable generators come to dominate the World’s energy transition then we will have gone from a system of high energy density to high materials demand. This is the inevitable result of going out into the environment to harvest low grade energy to do useful work
An energy system powered by wind and solar technologies differs profoundly from one fuelled by nuclear generators.
From the IEA report wind uses 11 times more materials than conventional nuclear while solar uses 17 times – say 14 times at 50/50 wind and solar. Some small nuclear power plants such as the General Electric BWRX 300 have even halved the materials demand of nuclear energy per unit of installed power.
So, how do you reconcile the difference between our findings?
1) Do more research
2)Take into account who pays the CSIRO bills